Toward high resolution estimates of Antarctic sea ice thickness
Dr Adam Steer
Press 's' (not p) while viewing to see slide notes.
Supervisory team:
Dr Christopher Watson :: Dr Jan Lieser :: Dr Arko Lucieer :: Dr Jon Osborn
With substantial assistance from:
Dr Petra Heil (AAD) :: Dr Anthony Worby (ACE CRC) :: Dr Robert Massom (AAD) :: Dr Guy Williams
Peter Jansen :: Kym Newbery :: Helicopter Resources :: P & O Polar :: Many minions who dug holes in the freezing cold.
Agenda
- Why - part 1 and 2:
- Sea ice, climate and the Southern Ocean
- Satellites, altimeters, and scales
- Instruments and methods:
- Helicopters and lasers
- Drills and shovels and lasers
- Underwater robots without lasers
- Results!
- Snow depth modelling
- Data coregistration
- Sea ice thickness
- Warts:
- What can be better?
- Summary
Why - part 1
The formation of sea ice on the southern ocean provides salty cold water to drive oceanic overturning circulation.
When present, sea ice interferes with ocean/atmosphere heat exchange - acting as an insulator
Sea ice interferes with the exchange of momentum between the ocean and atmosphere. Its drift also transports fresh water from the site of ice formation to the site of ice melt
Sea ice provides a unique winter habitat for life in the southern ocean, and its melt contributes to spring plankton blooms
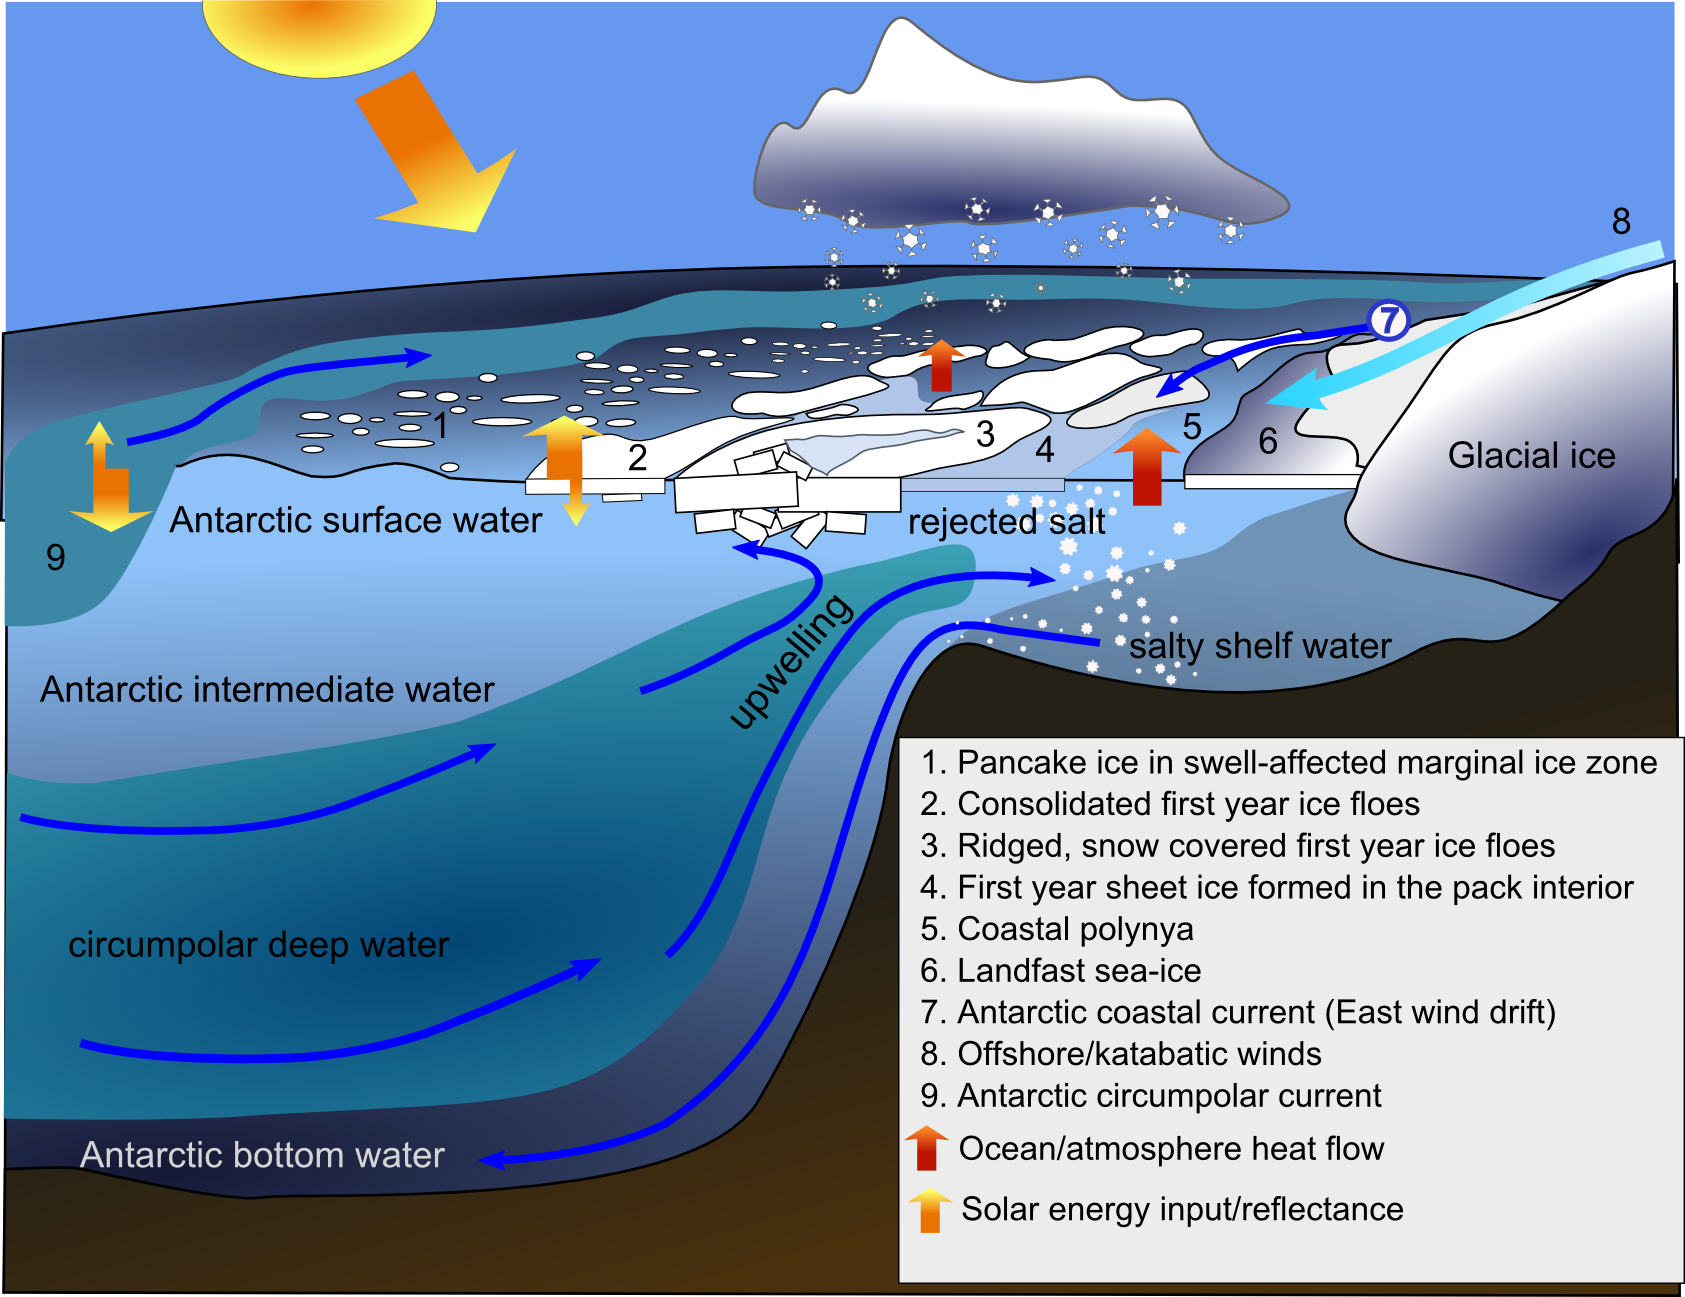
The thickness distribution of Antarctic sea ice is a key measure of the magnitude of all these effects.
but:
The thickness distribution of Antarctic sea ice is very dynamic, and very poorly described. Its variability at floe to sub-floe scales is unknown.
Why - part 2
Circumpolar sea ice thickness distribution monitoring is really only feasible using satellite instruments, and the only instruments which are so far practial are altimeters - for example ICESat/GLAS, or CryoSAT-2
...but sea ice is highly variable at sub-100m scales - which satellite altimeters cannot (yet) detect
...and we didn't know if empirical relationships used for estimating sea ice thickness using altimetry work at high resolutions
...and finally - we didn't know how to properly validate estimates of sea ice thickness from altimetry + empirical models
The six year, much sleep deprivation question:
Can we estimate sea ice thickness over areas big enough to compare with satellites, at a resolution comparable to field observations?
Some key concepts
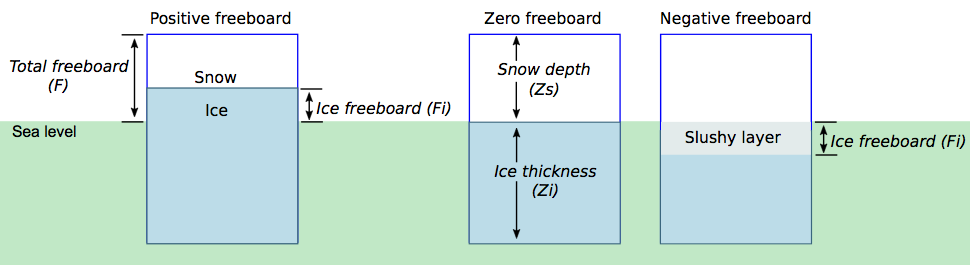
Figure 3 in Worby, A. P., Geiger, C. A., Paget, M. J., Woert, M. L. V., Ackley, S. F., and Deliberty, T. L., 2008a: Thickness distribution of Antarctic sea ice. Journal of Geophysical Research, 113, 1–14.
Instruments and data
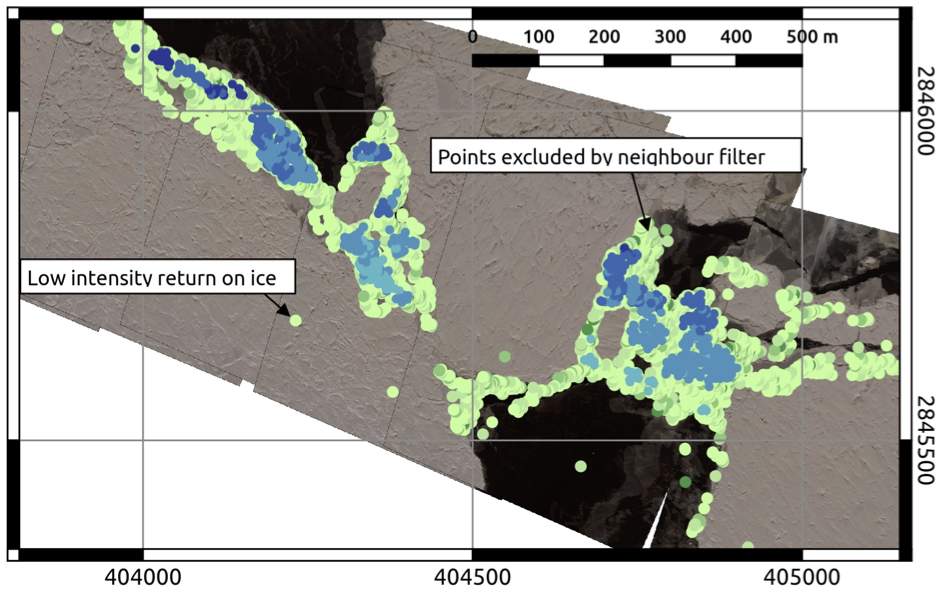
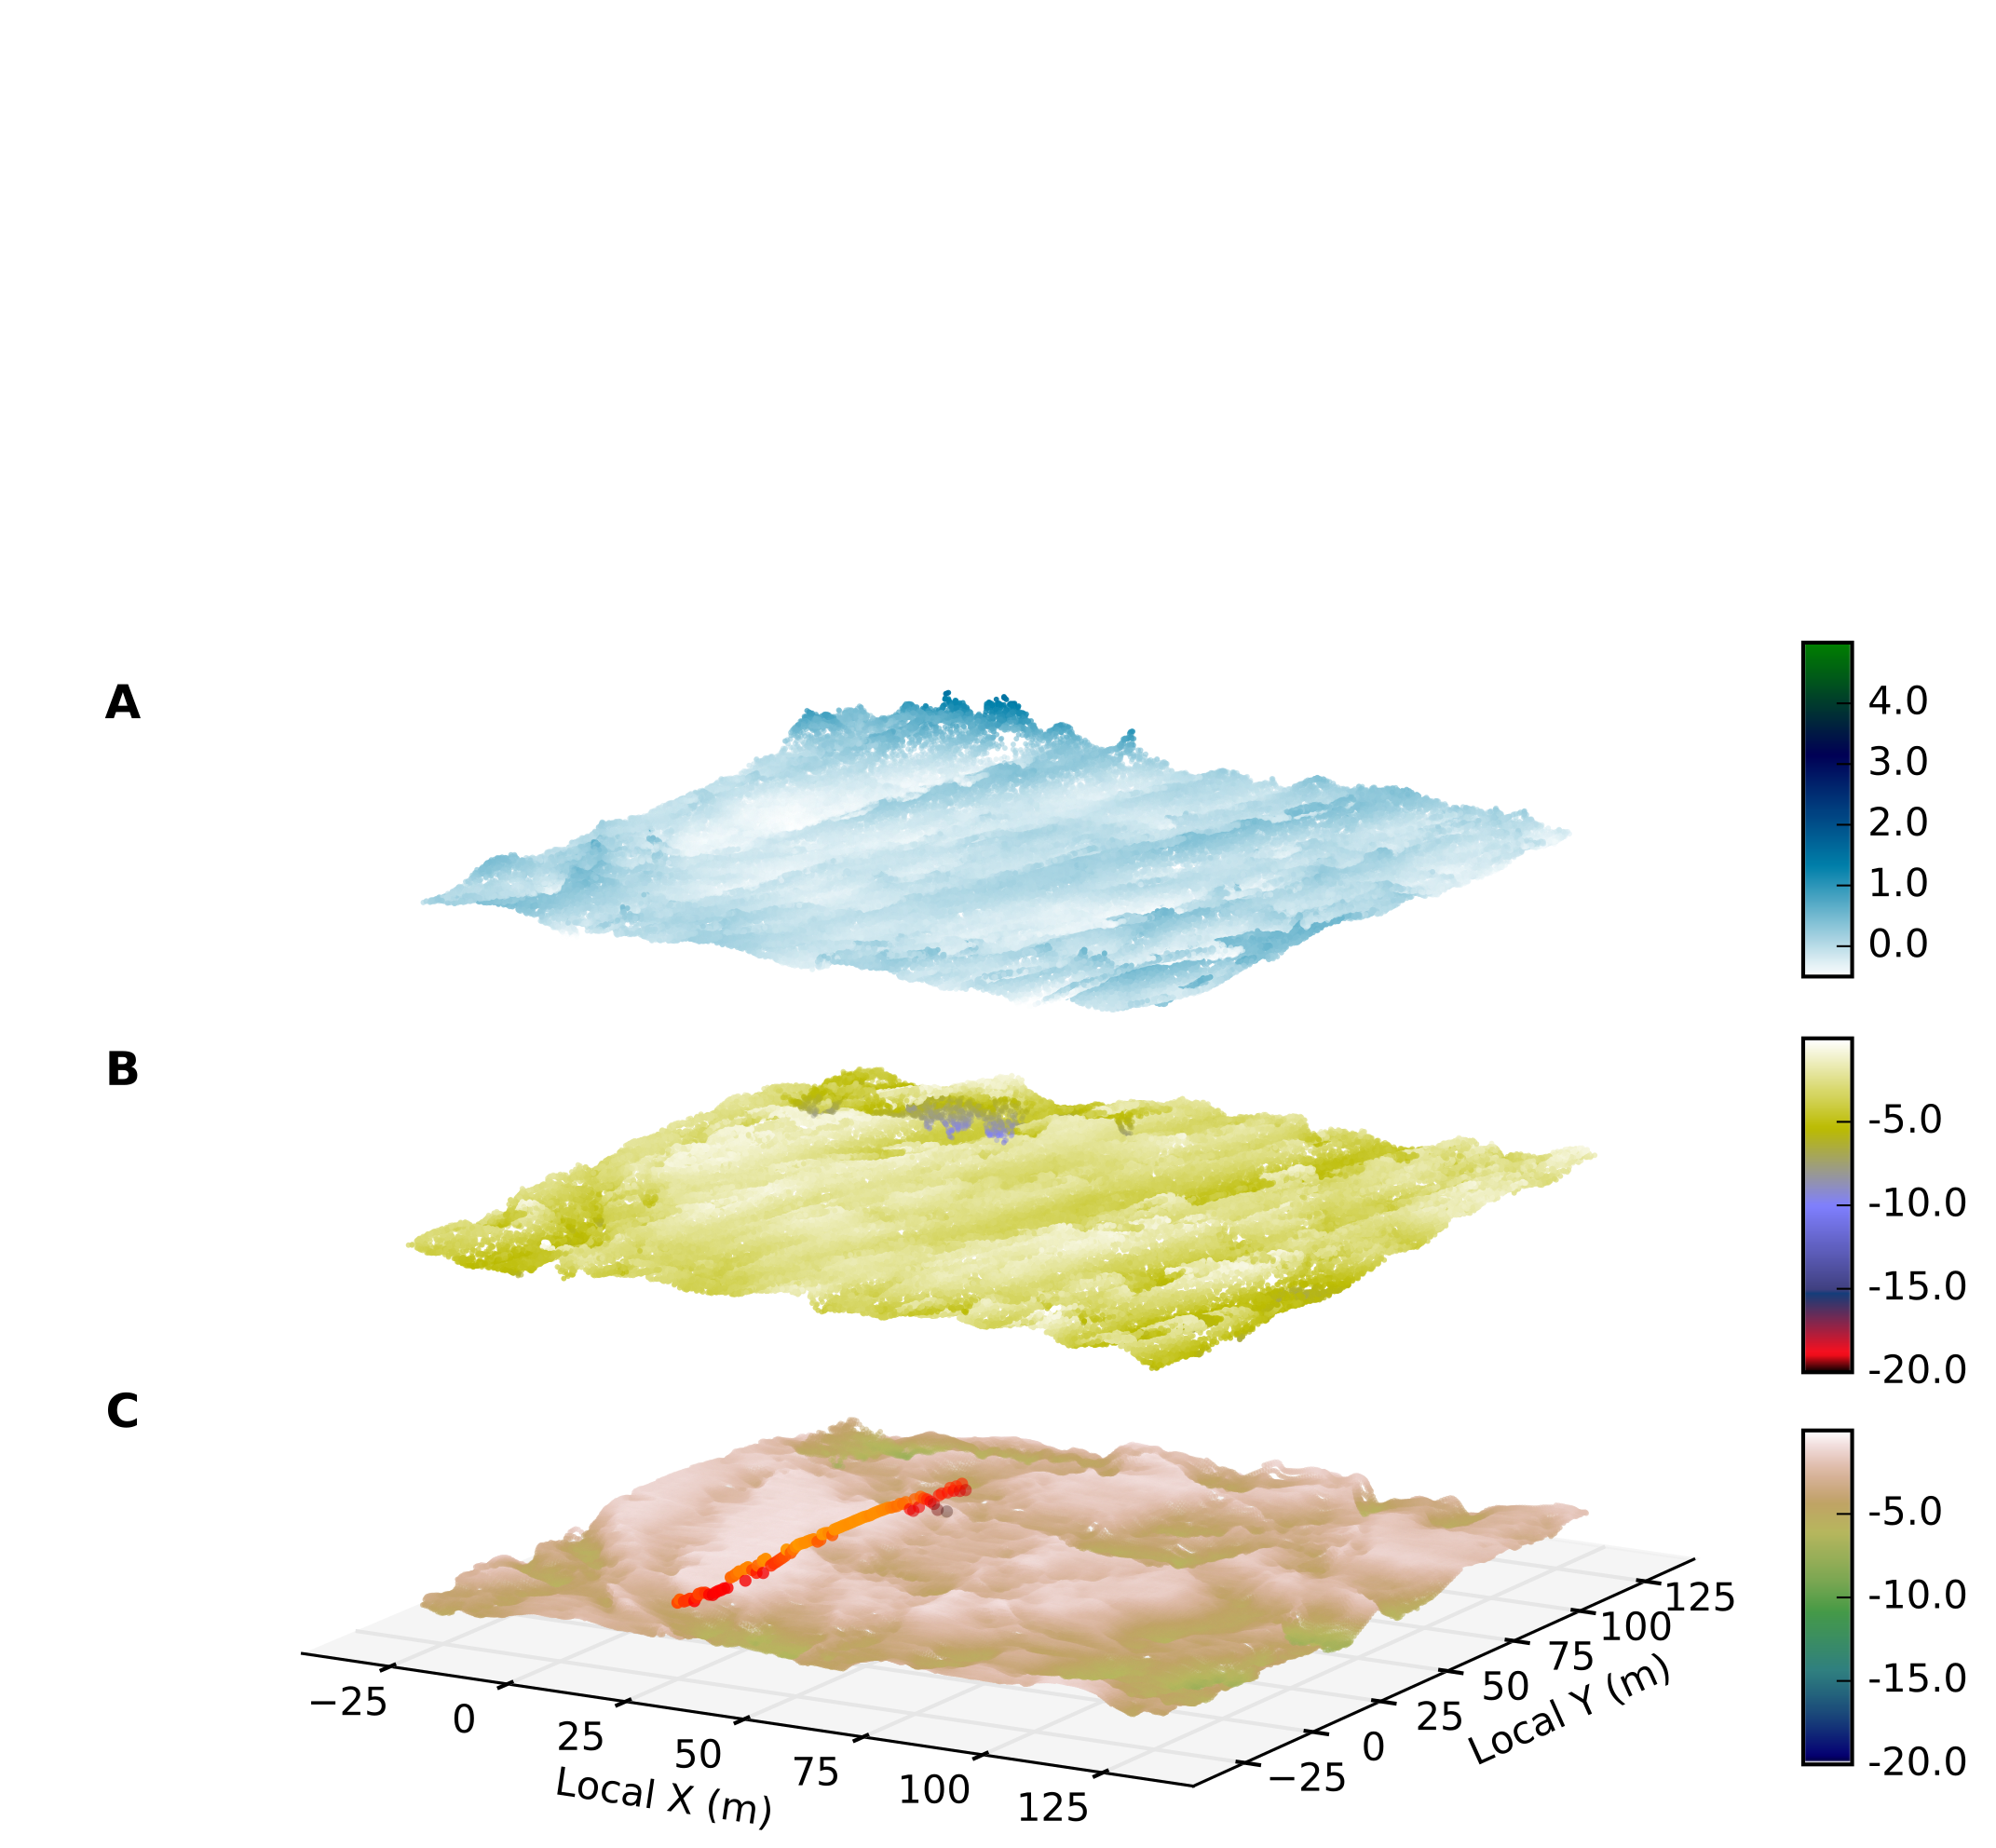
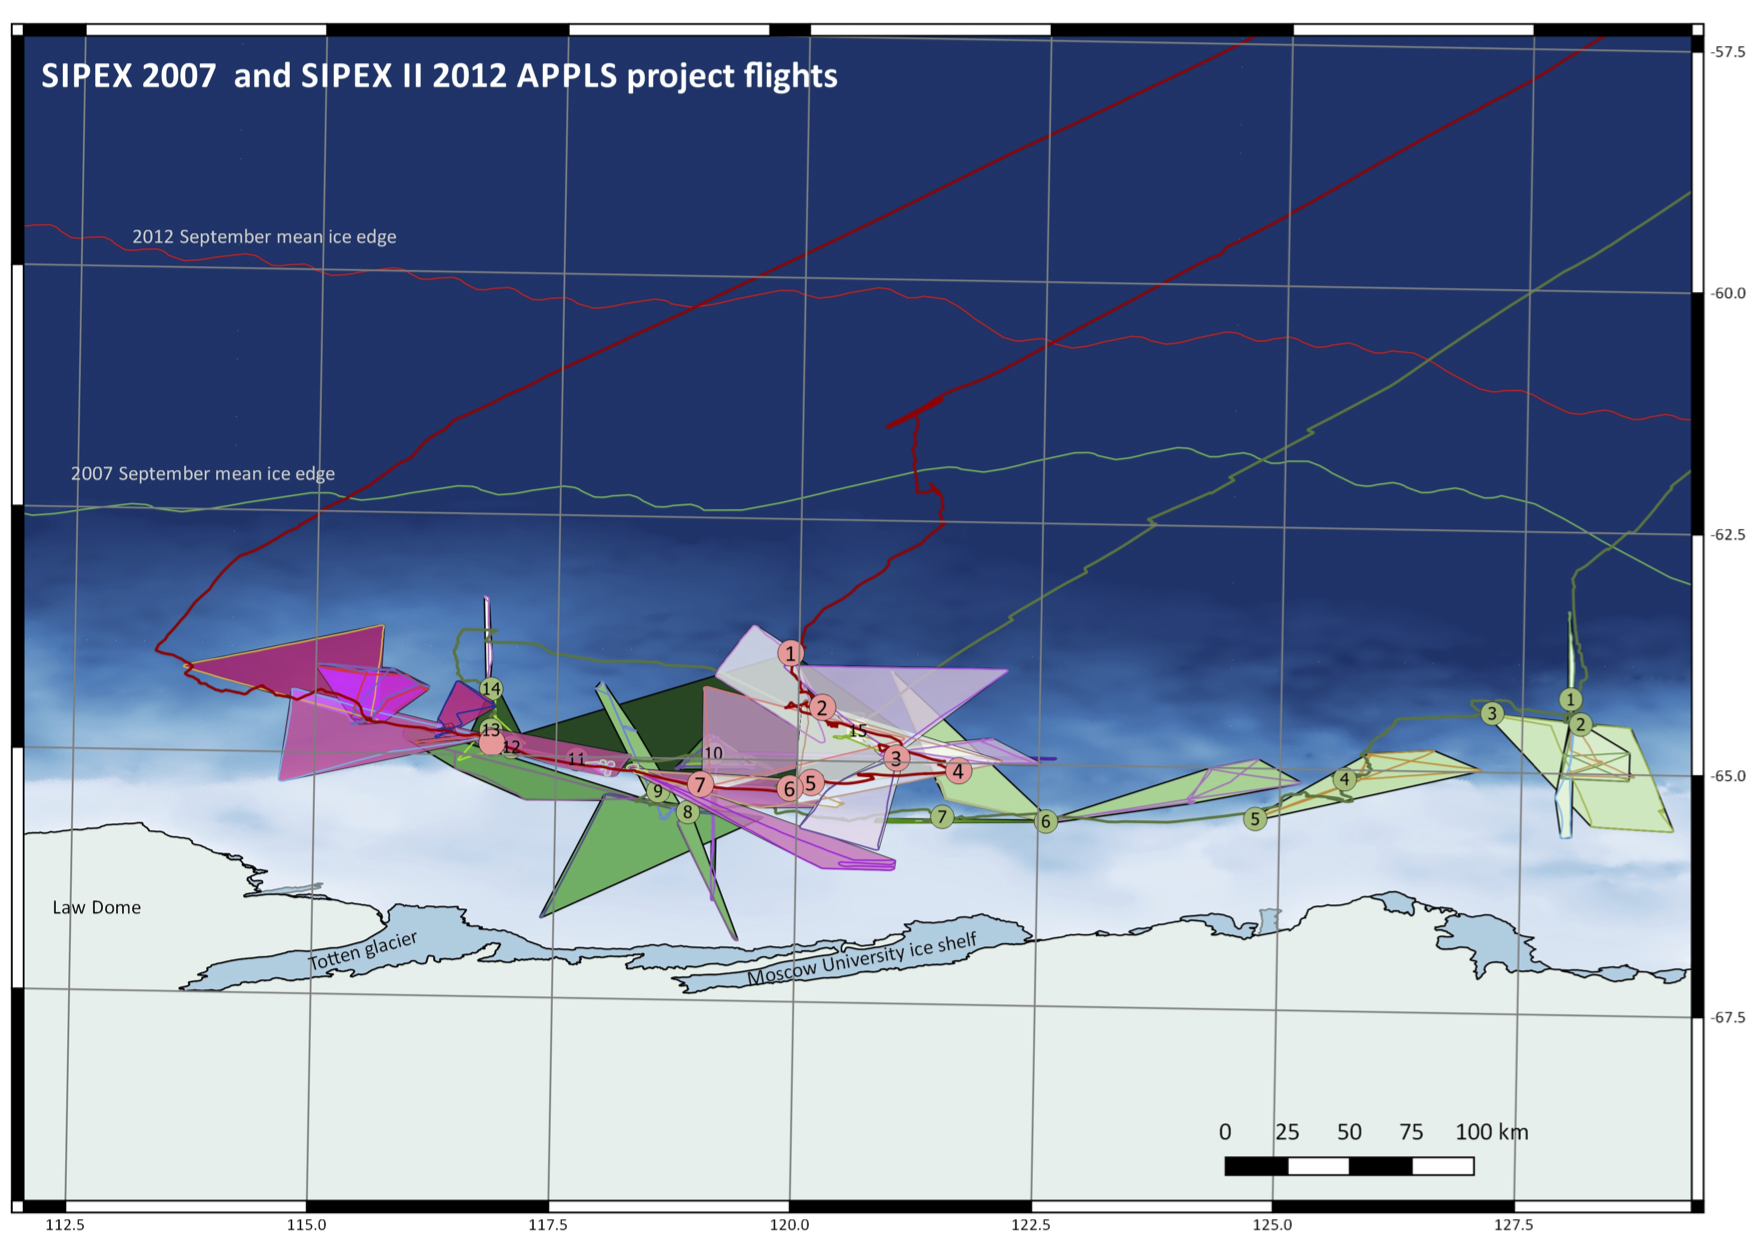
Airborne LiDAR over sea ice
The Aerial Photography, Pyrometer and Laser Scanner (APPLS) instrument package
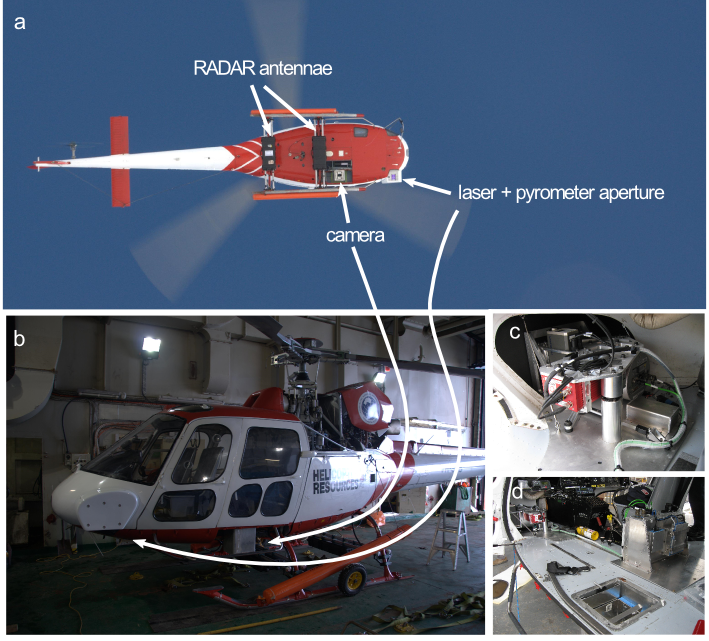
So we take LiDAR observations. Now what? How do we know where 'sea level' is? And our survey medium is always moving.
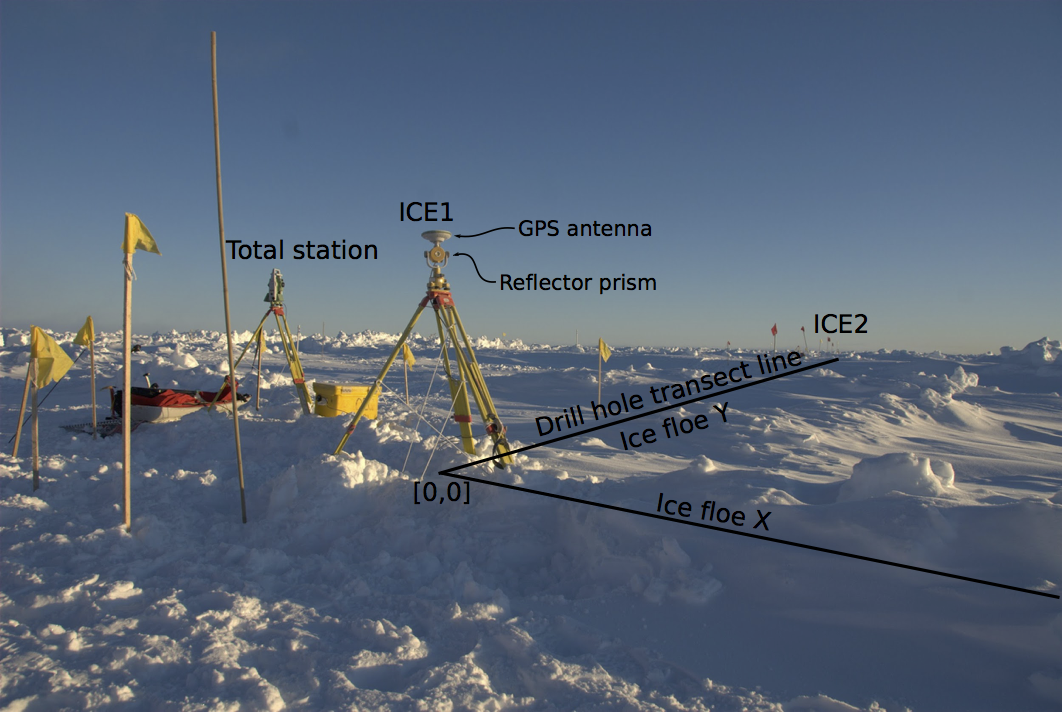
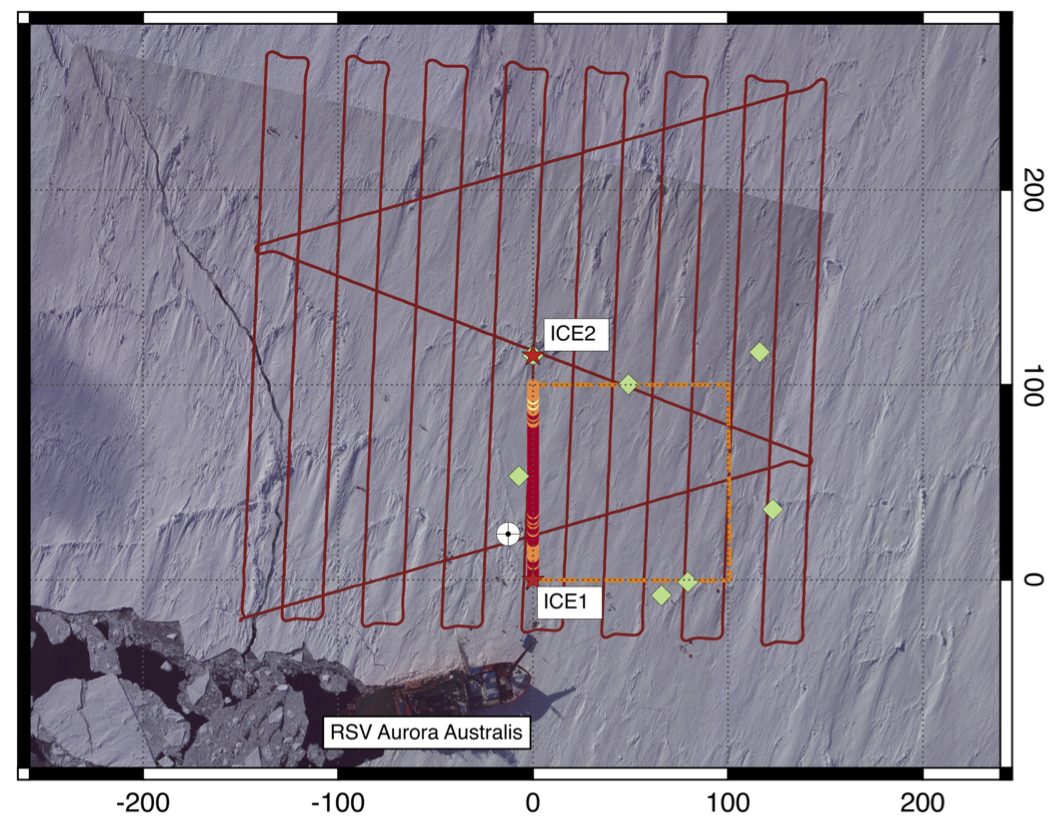
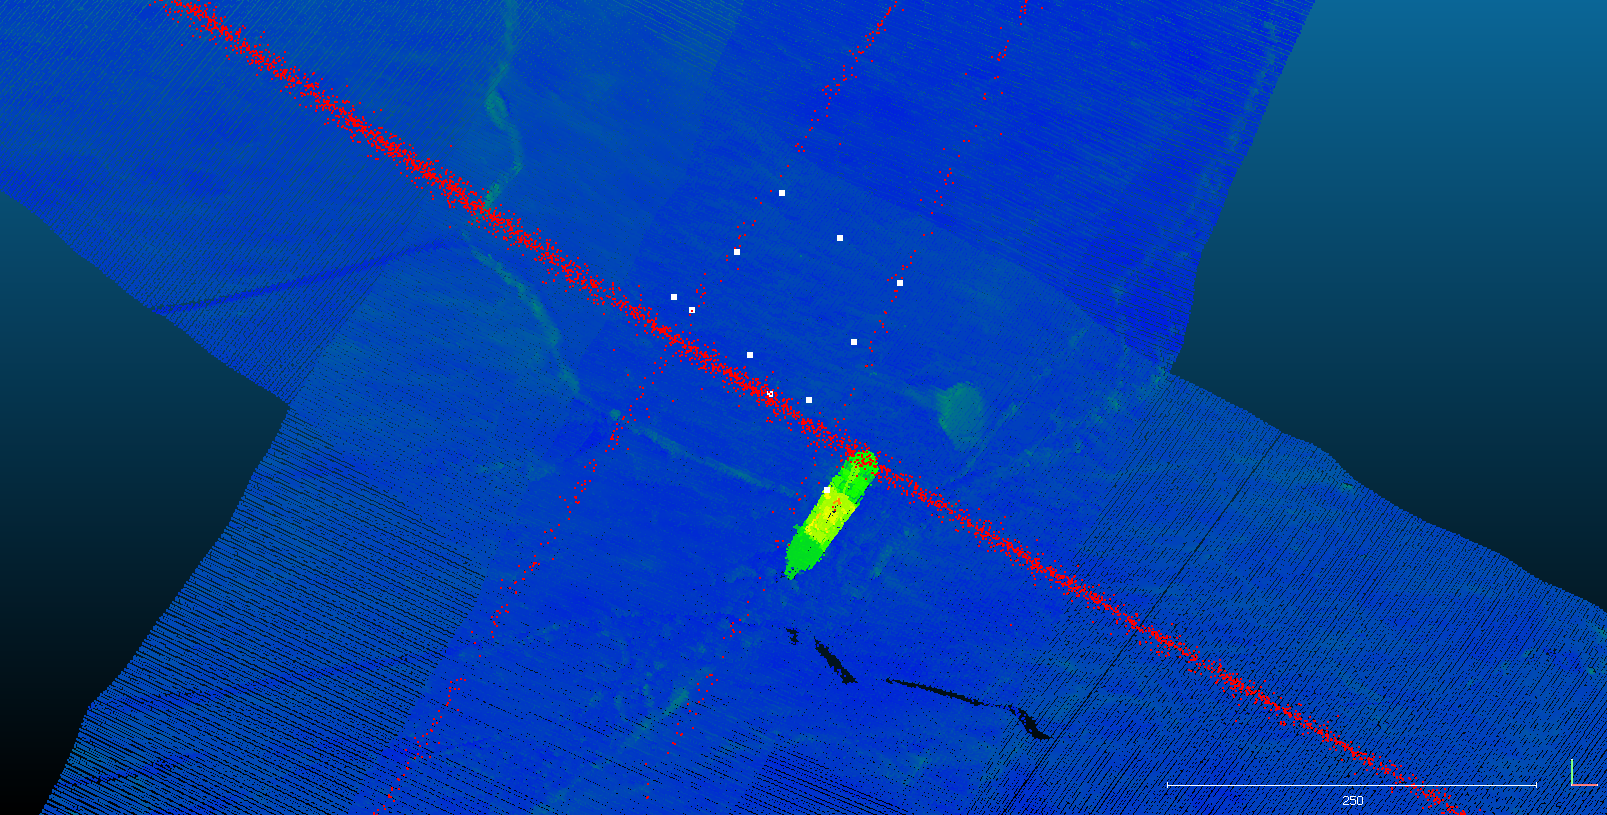
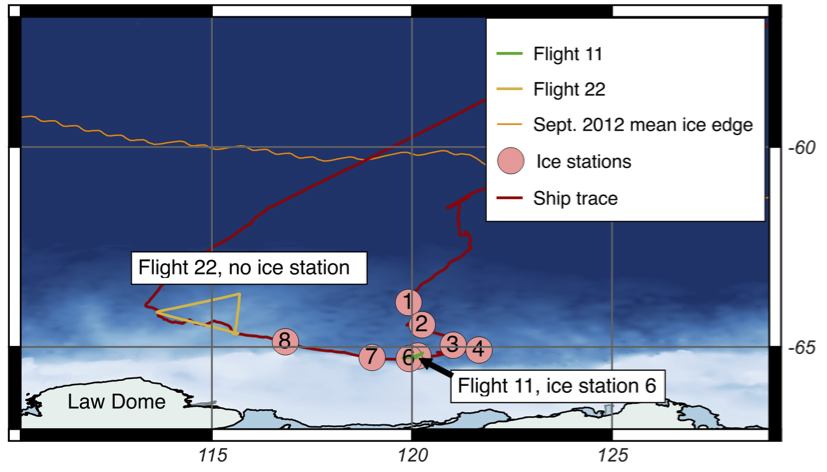
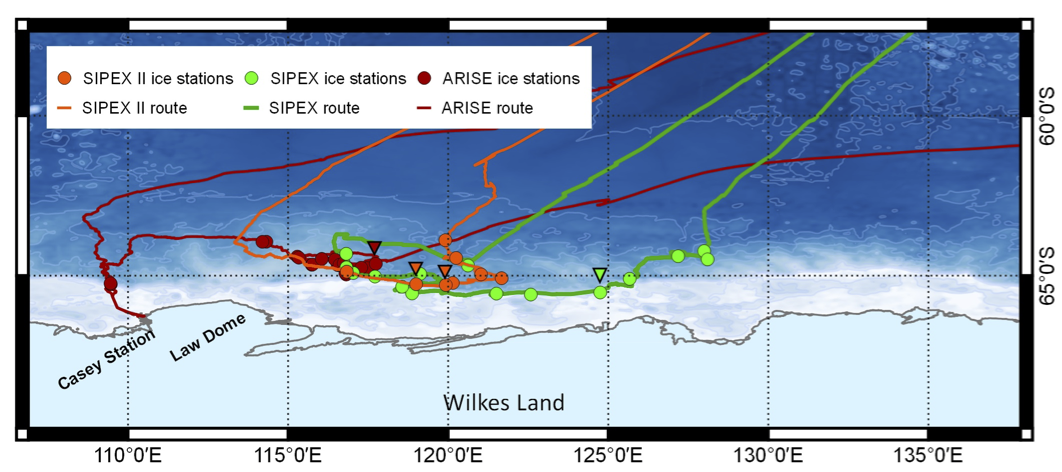
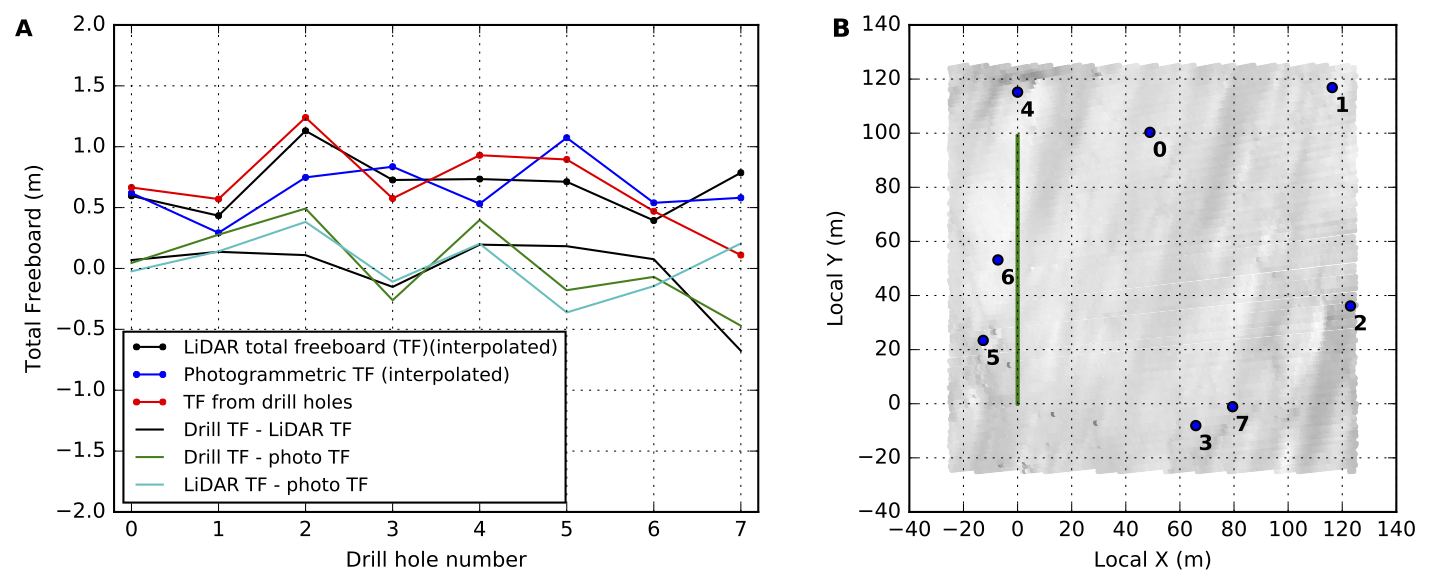
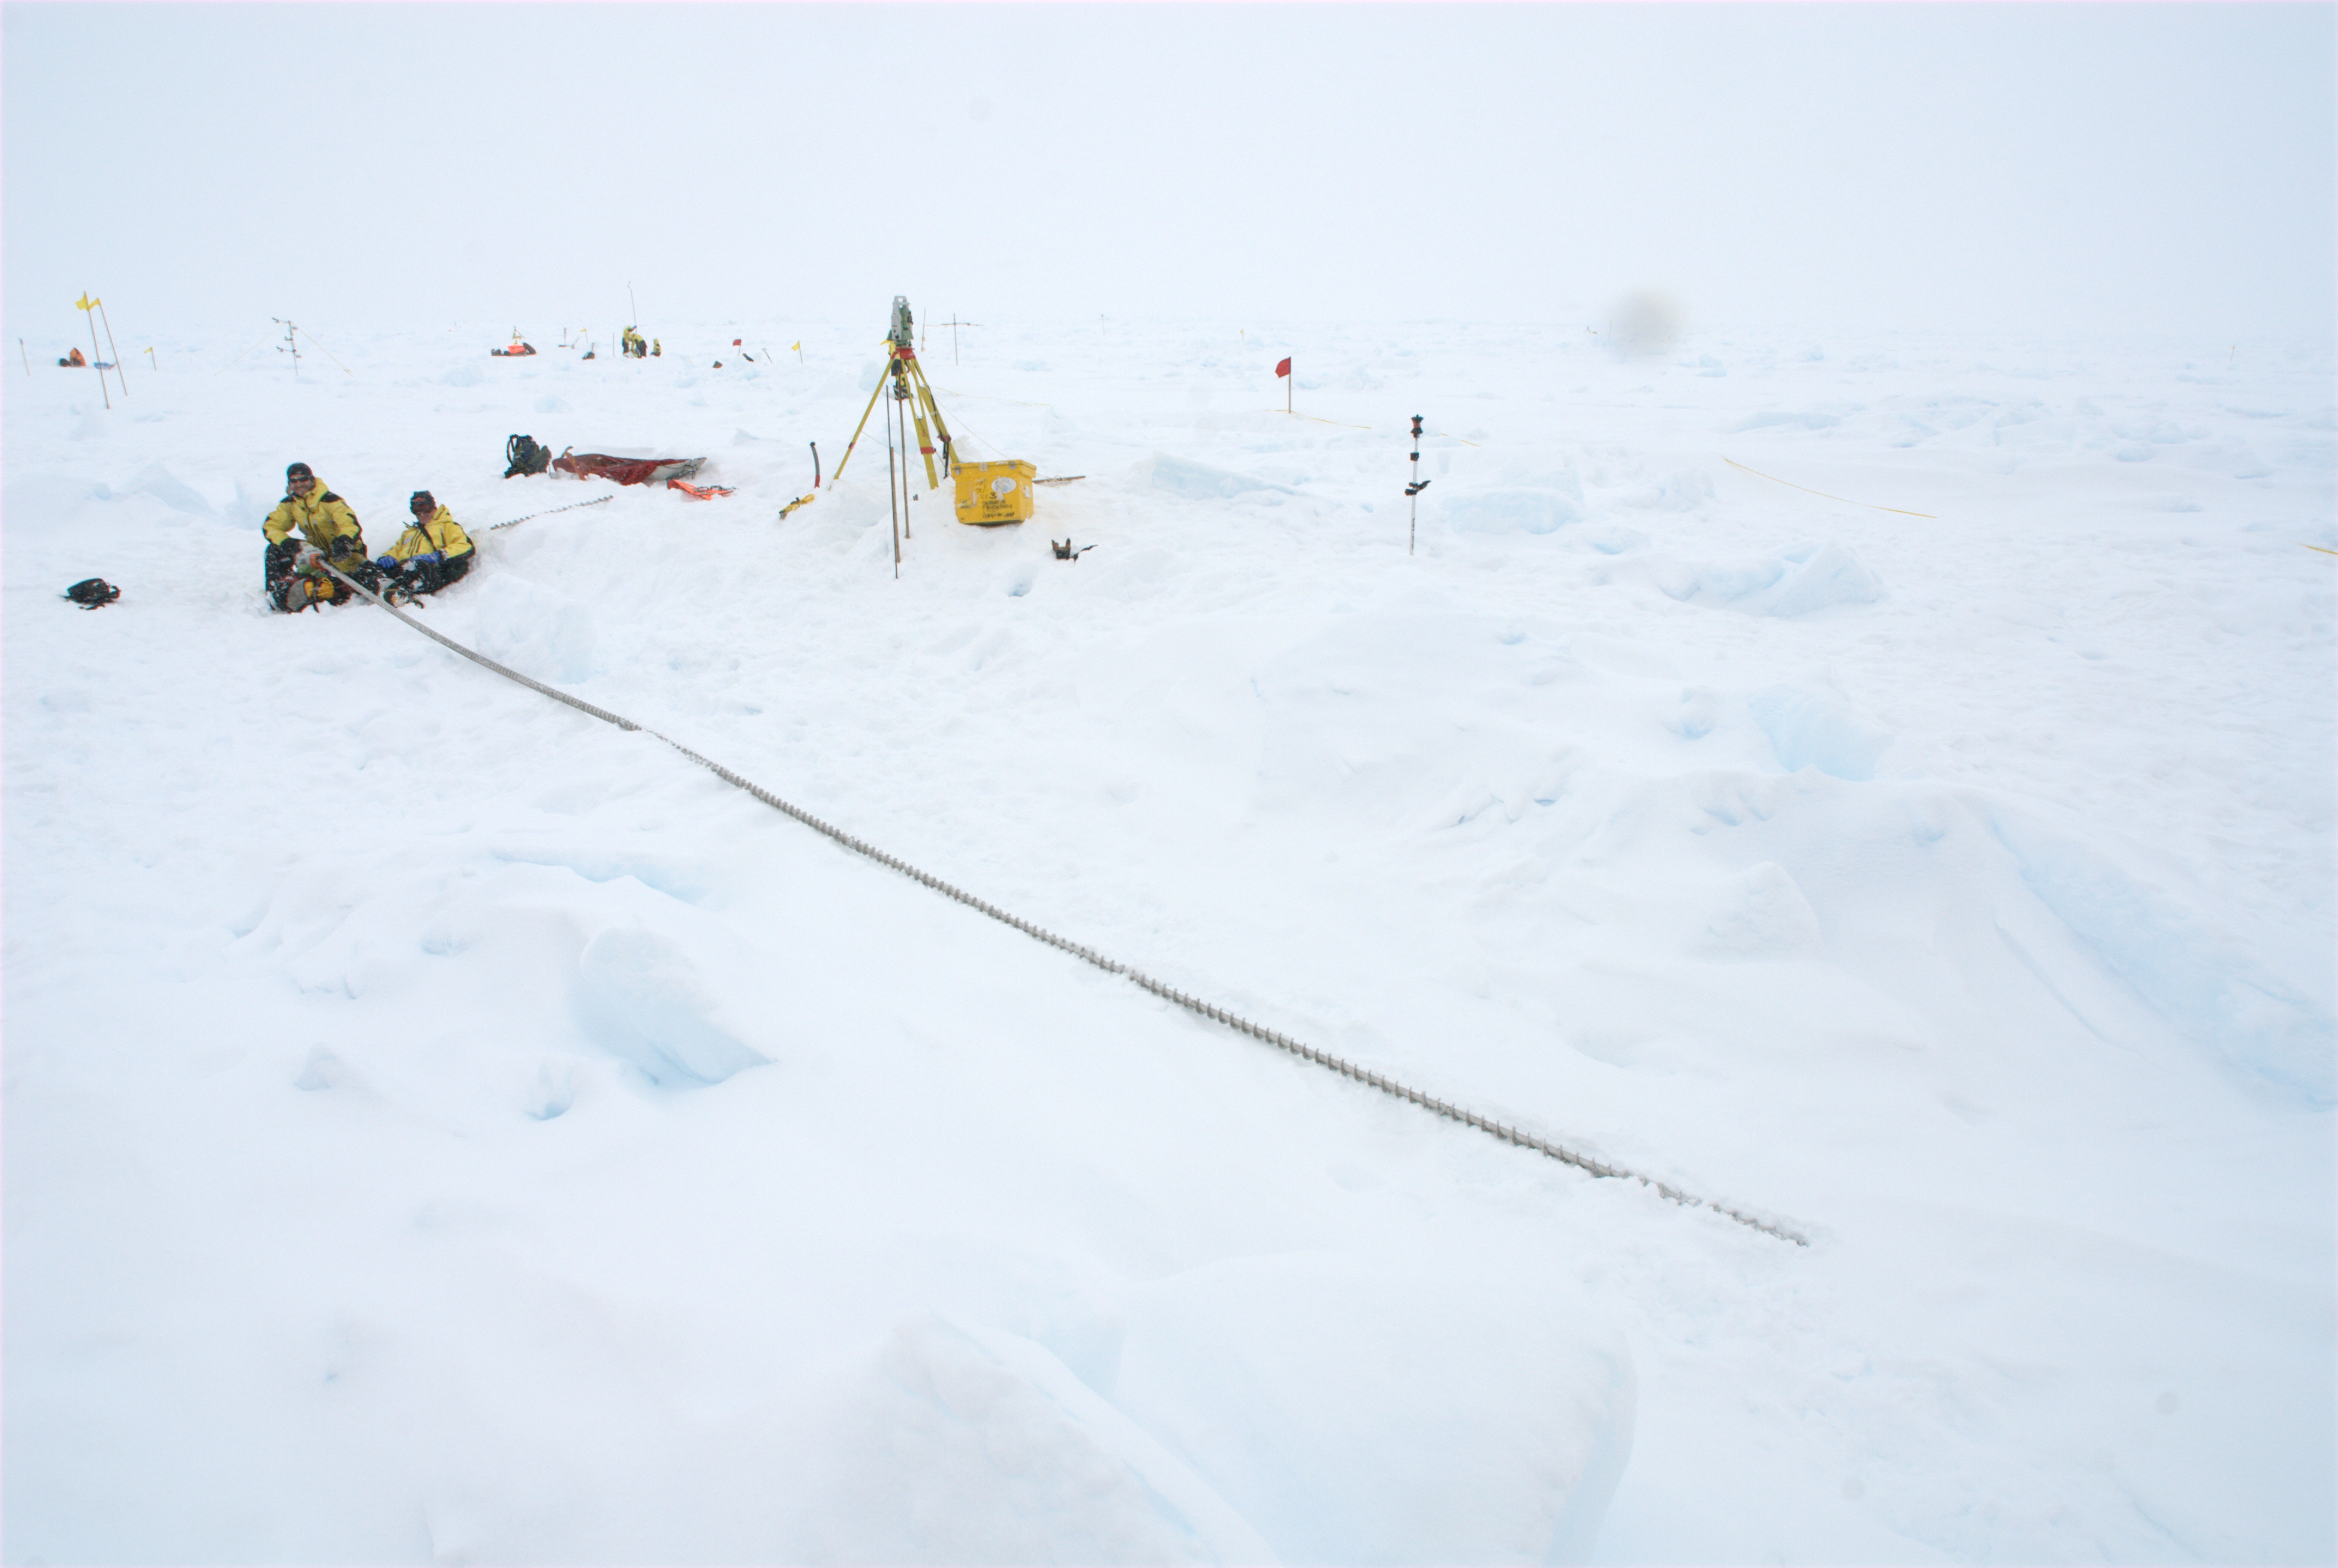
Drill holes and ship-based observations
A ship, some drills, many minions, and a robotic total station
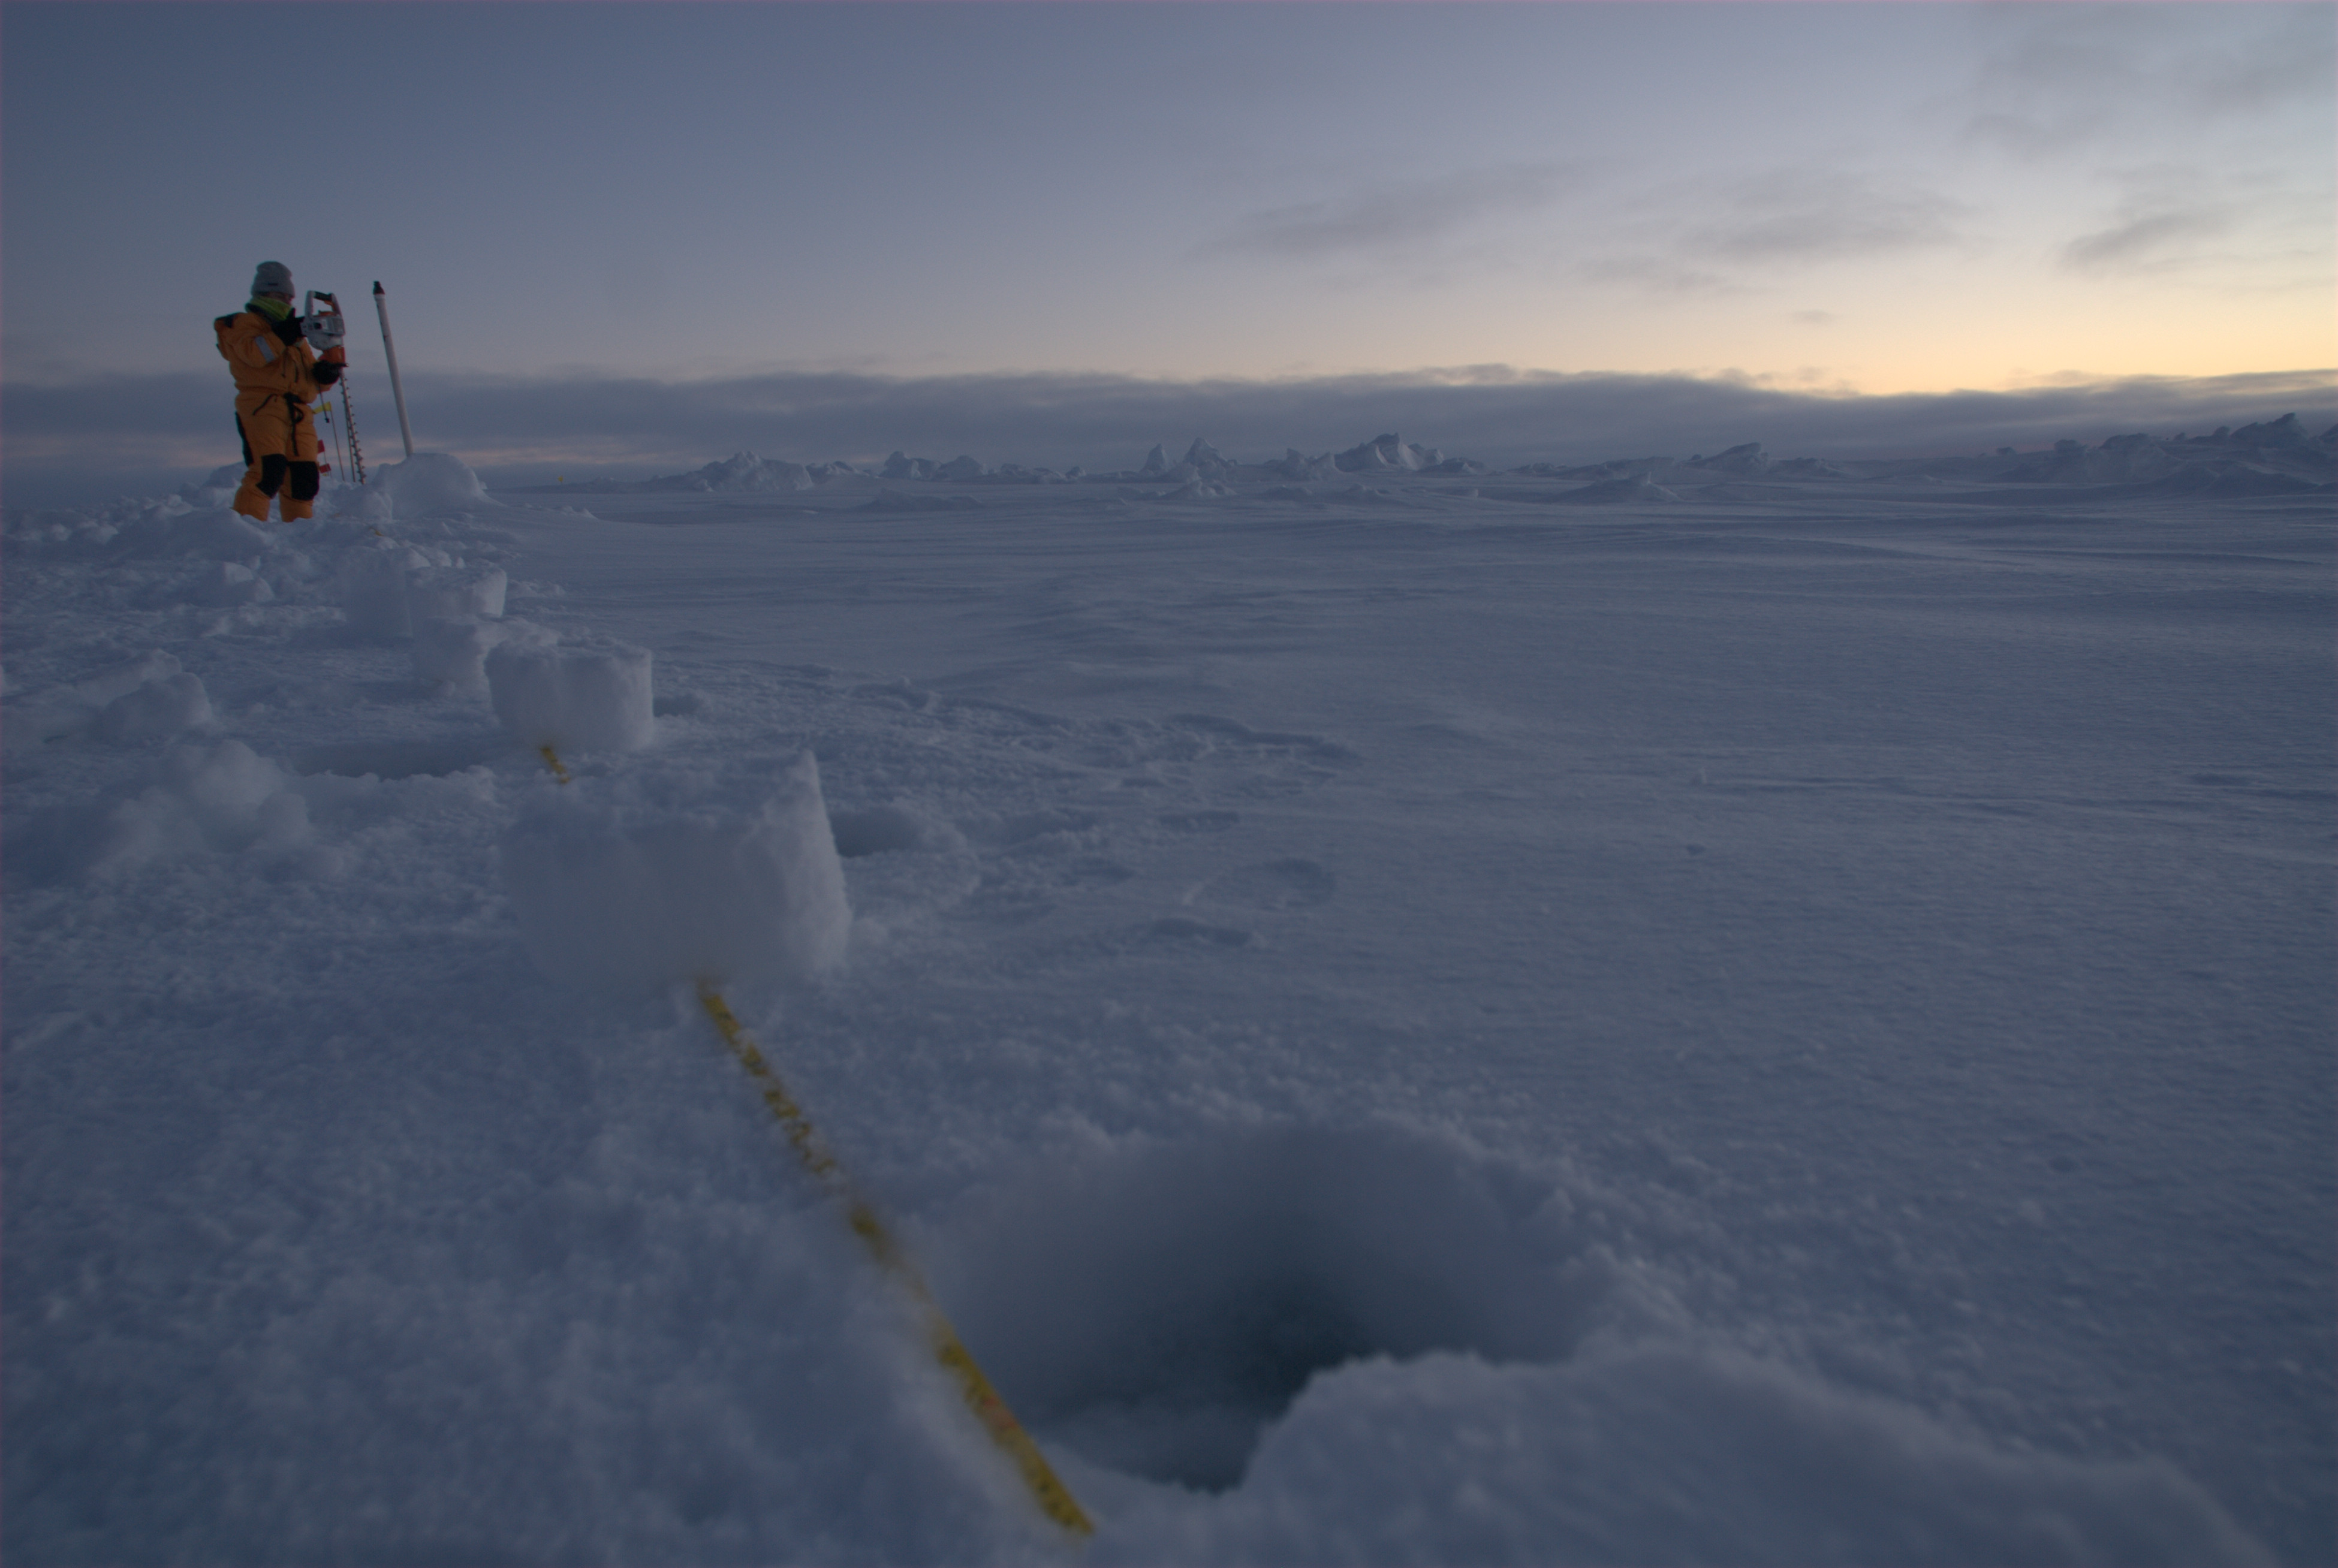
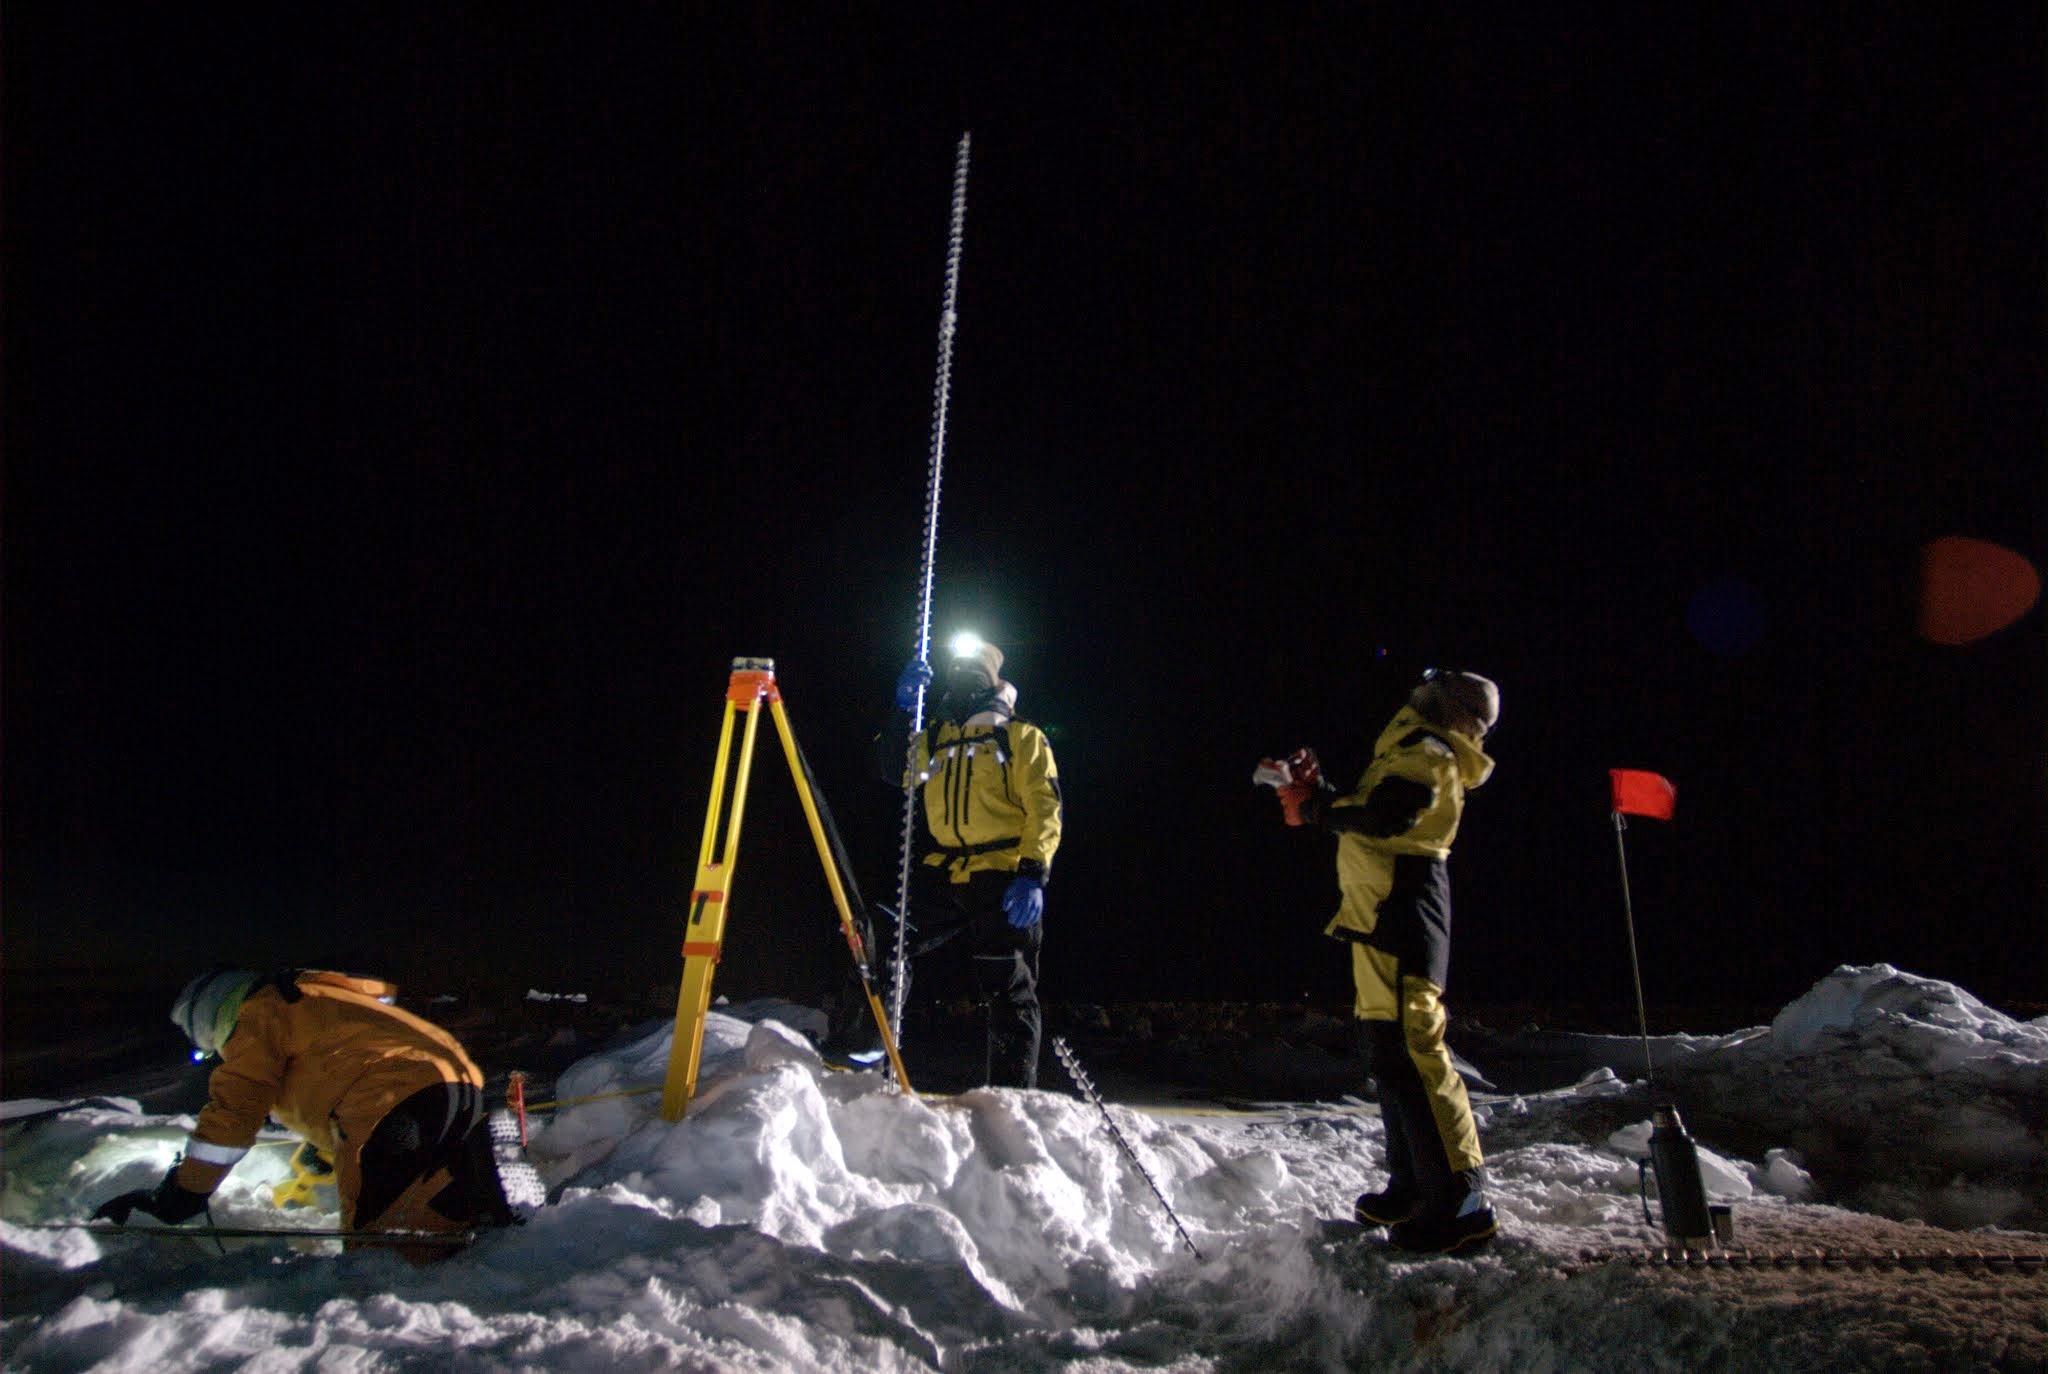
Drill holes are fun, but generally collect very small 2D samples at disparate locations and times. Sea ice is three dimensional. How do we get that missing dimension and use these labour-intensive data well? Also, how well do altimetry-based estimates match observations?
Innovations in field observation
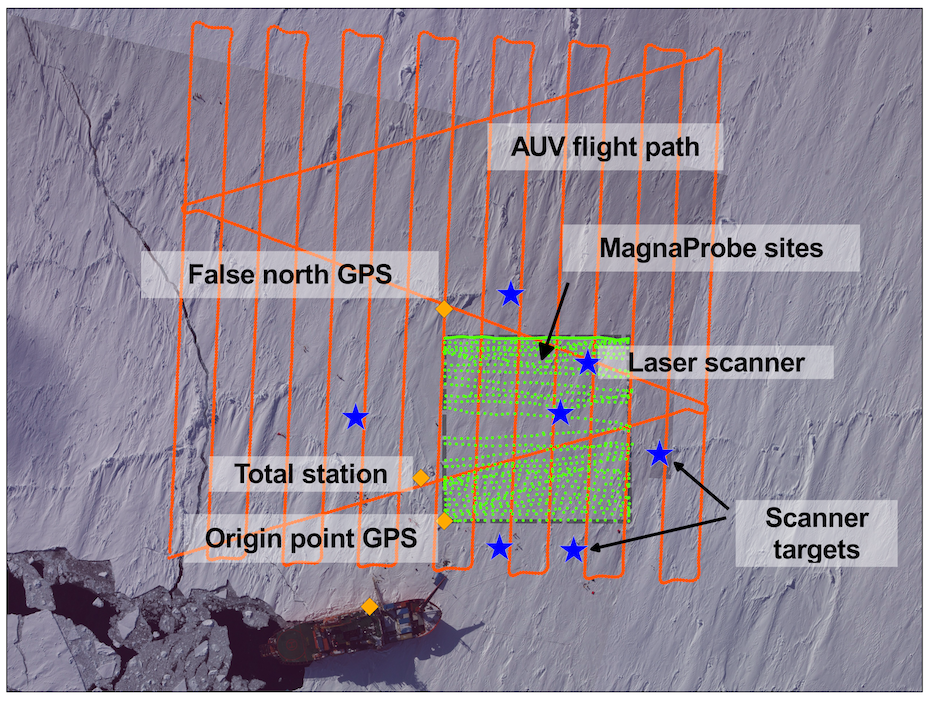
Ship-based ice observations of ice thickness form the 'validation mainstay' - do altimetry-based estimates match these?
Figure 6 in Worby, A. P., Geiger, C. A., Paget, M. J., Woert, M. L. V., Ackley, S. F., and Deliberty, T. L., 2008a: Thickness distribution of Antarctic sea ice. Journal of Geophysical Research, 113, 1–14.
Undersea robots without lasers
Observing ice draft from below...
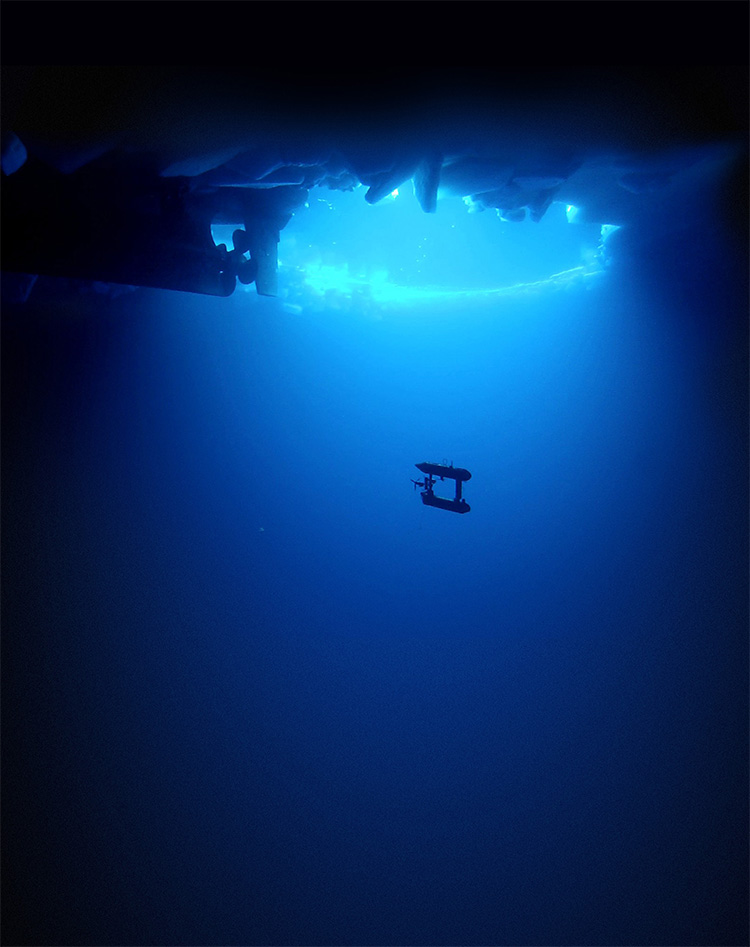
Photo by the ROV team (Klaus Meiners, Kym Newbery et al), and borrowed from here: https://www.whoi.edu/news-release/SeabedAntarctic
Analysis methods
The basic process
- measure height of sea ice above sea level (total freeboard)
- estimate how much of that height is snow (snow depth)
- estimate the densities of snow, ice and seawater in the region
- use the total freeboard, estimated snow depth and densities to drive a hydrostatic model for sea ice thickness
- coregister these estimates with drill hole and AUV data, accounting for ice drift and rotation
- estimate LiDAR observation uncertainties, and then ice thickness uncertainties
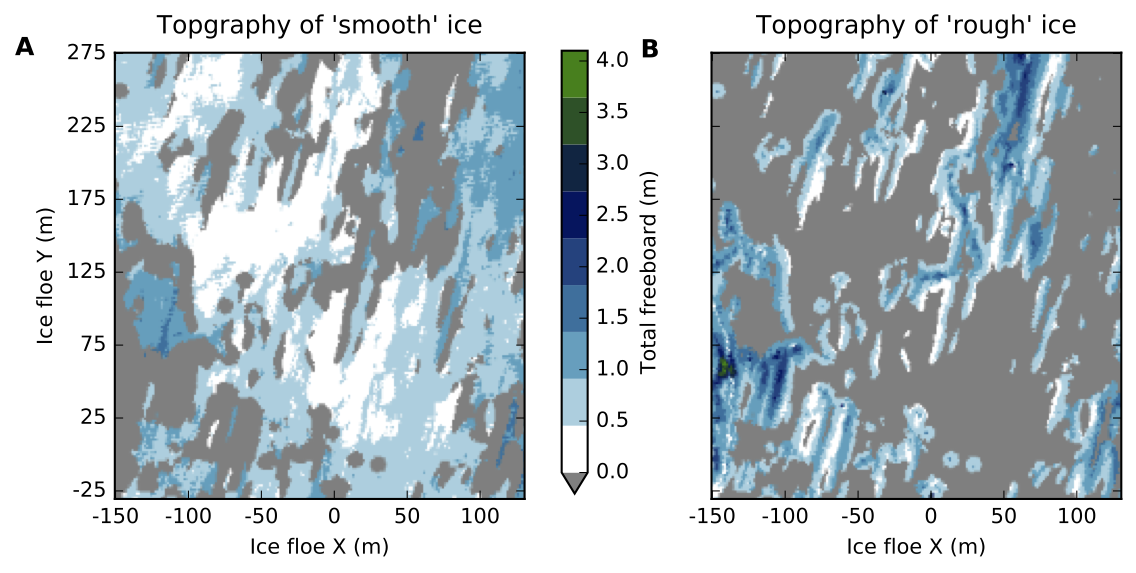
Sea ice total freeboard
Mainly determining 'sea level' from LiDAR observations


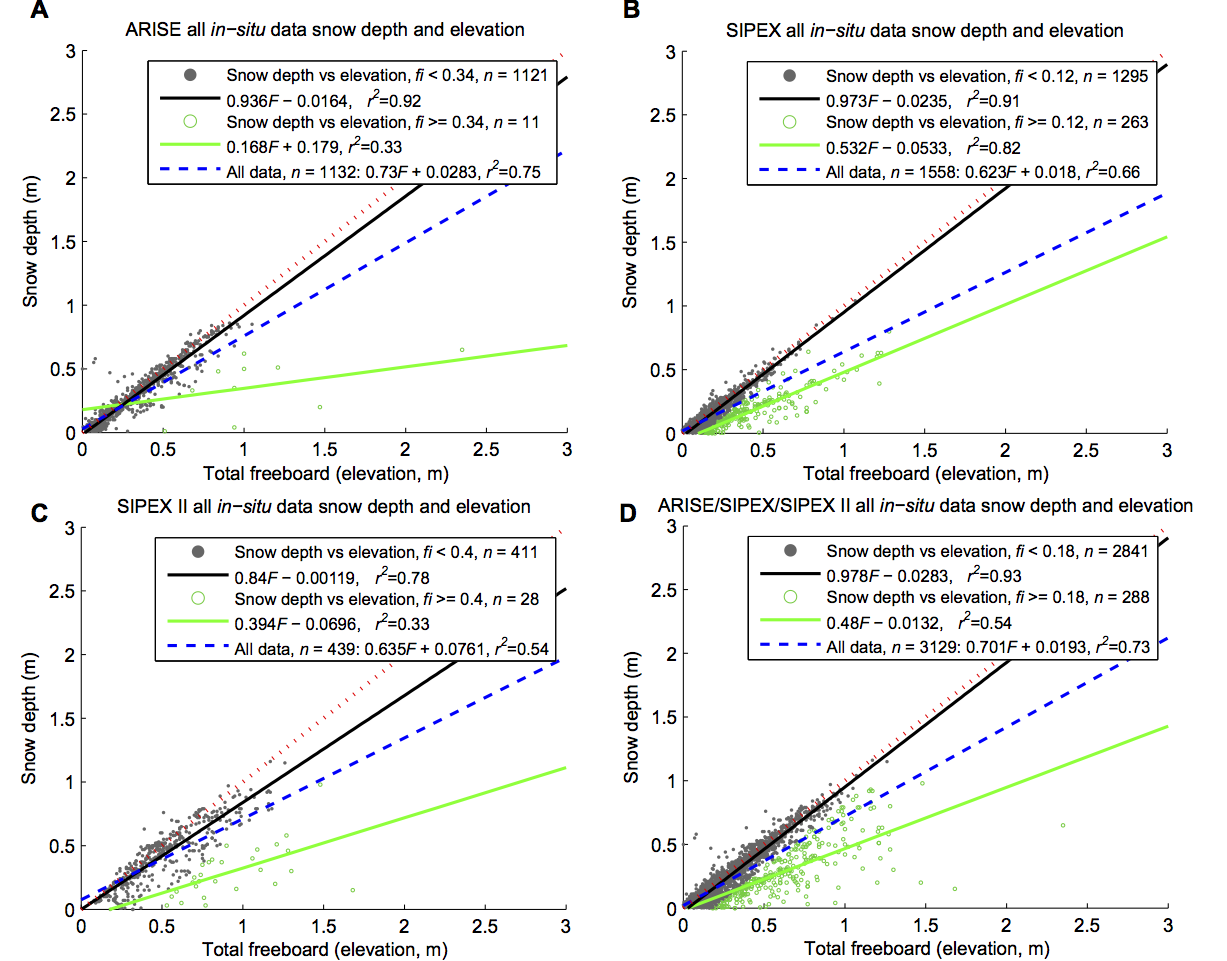
Snow depth
Sparse observations, limited to survey transect lines - so snow depth must be estimated over a full LiDAR swath
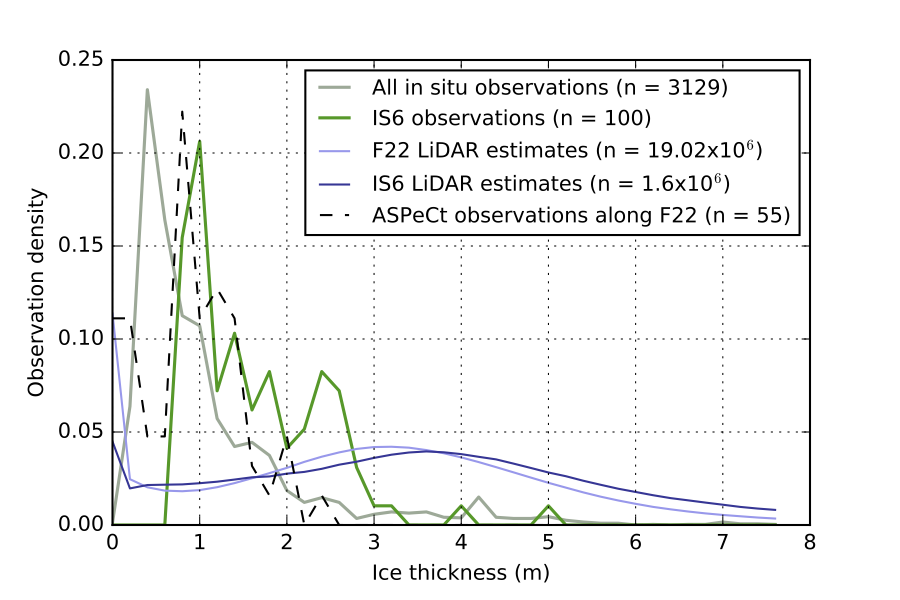
3912 drill holes with snow depth and total freeboard
Ice draft
Data were provided by Dr. Guy Williams - see:
Williams, G., Maksym, T., Wilkinson, J., Kunz, C., Murphy, C., Kimball, P., and Singh, H., 2014b: Thick and deformed Antarctic sea ice mapped with autonomous underwater vehicles. Nature Geoscience, (November), 1–7.
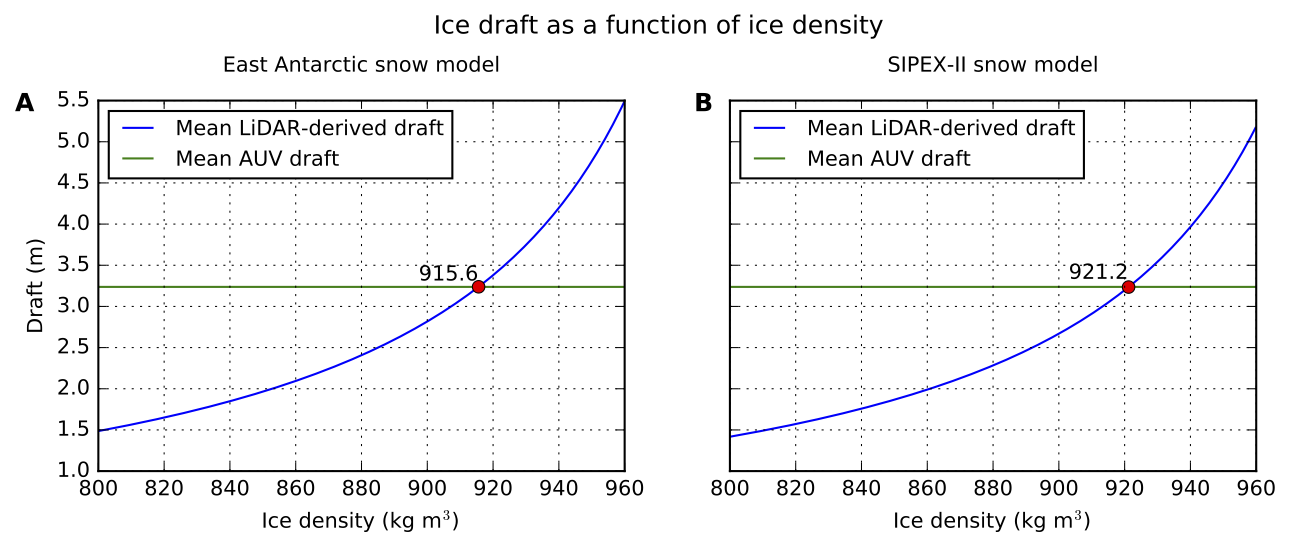
Ice density
What to use? Range from 870 - 930 kg/m3
Solution - empirically determine a 'floe scale' ice density using observed ice draft
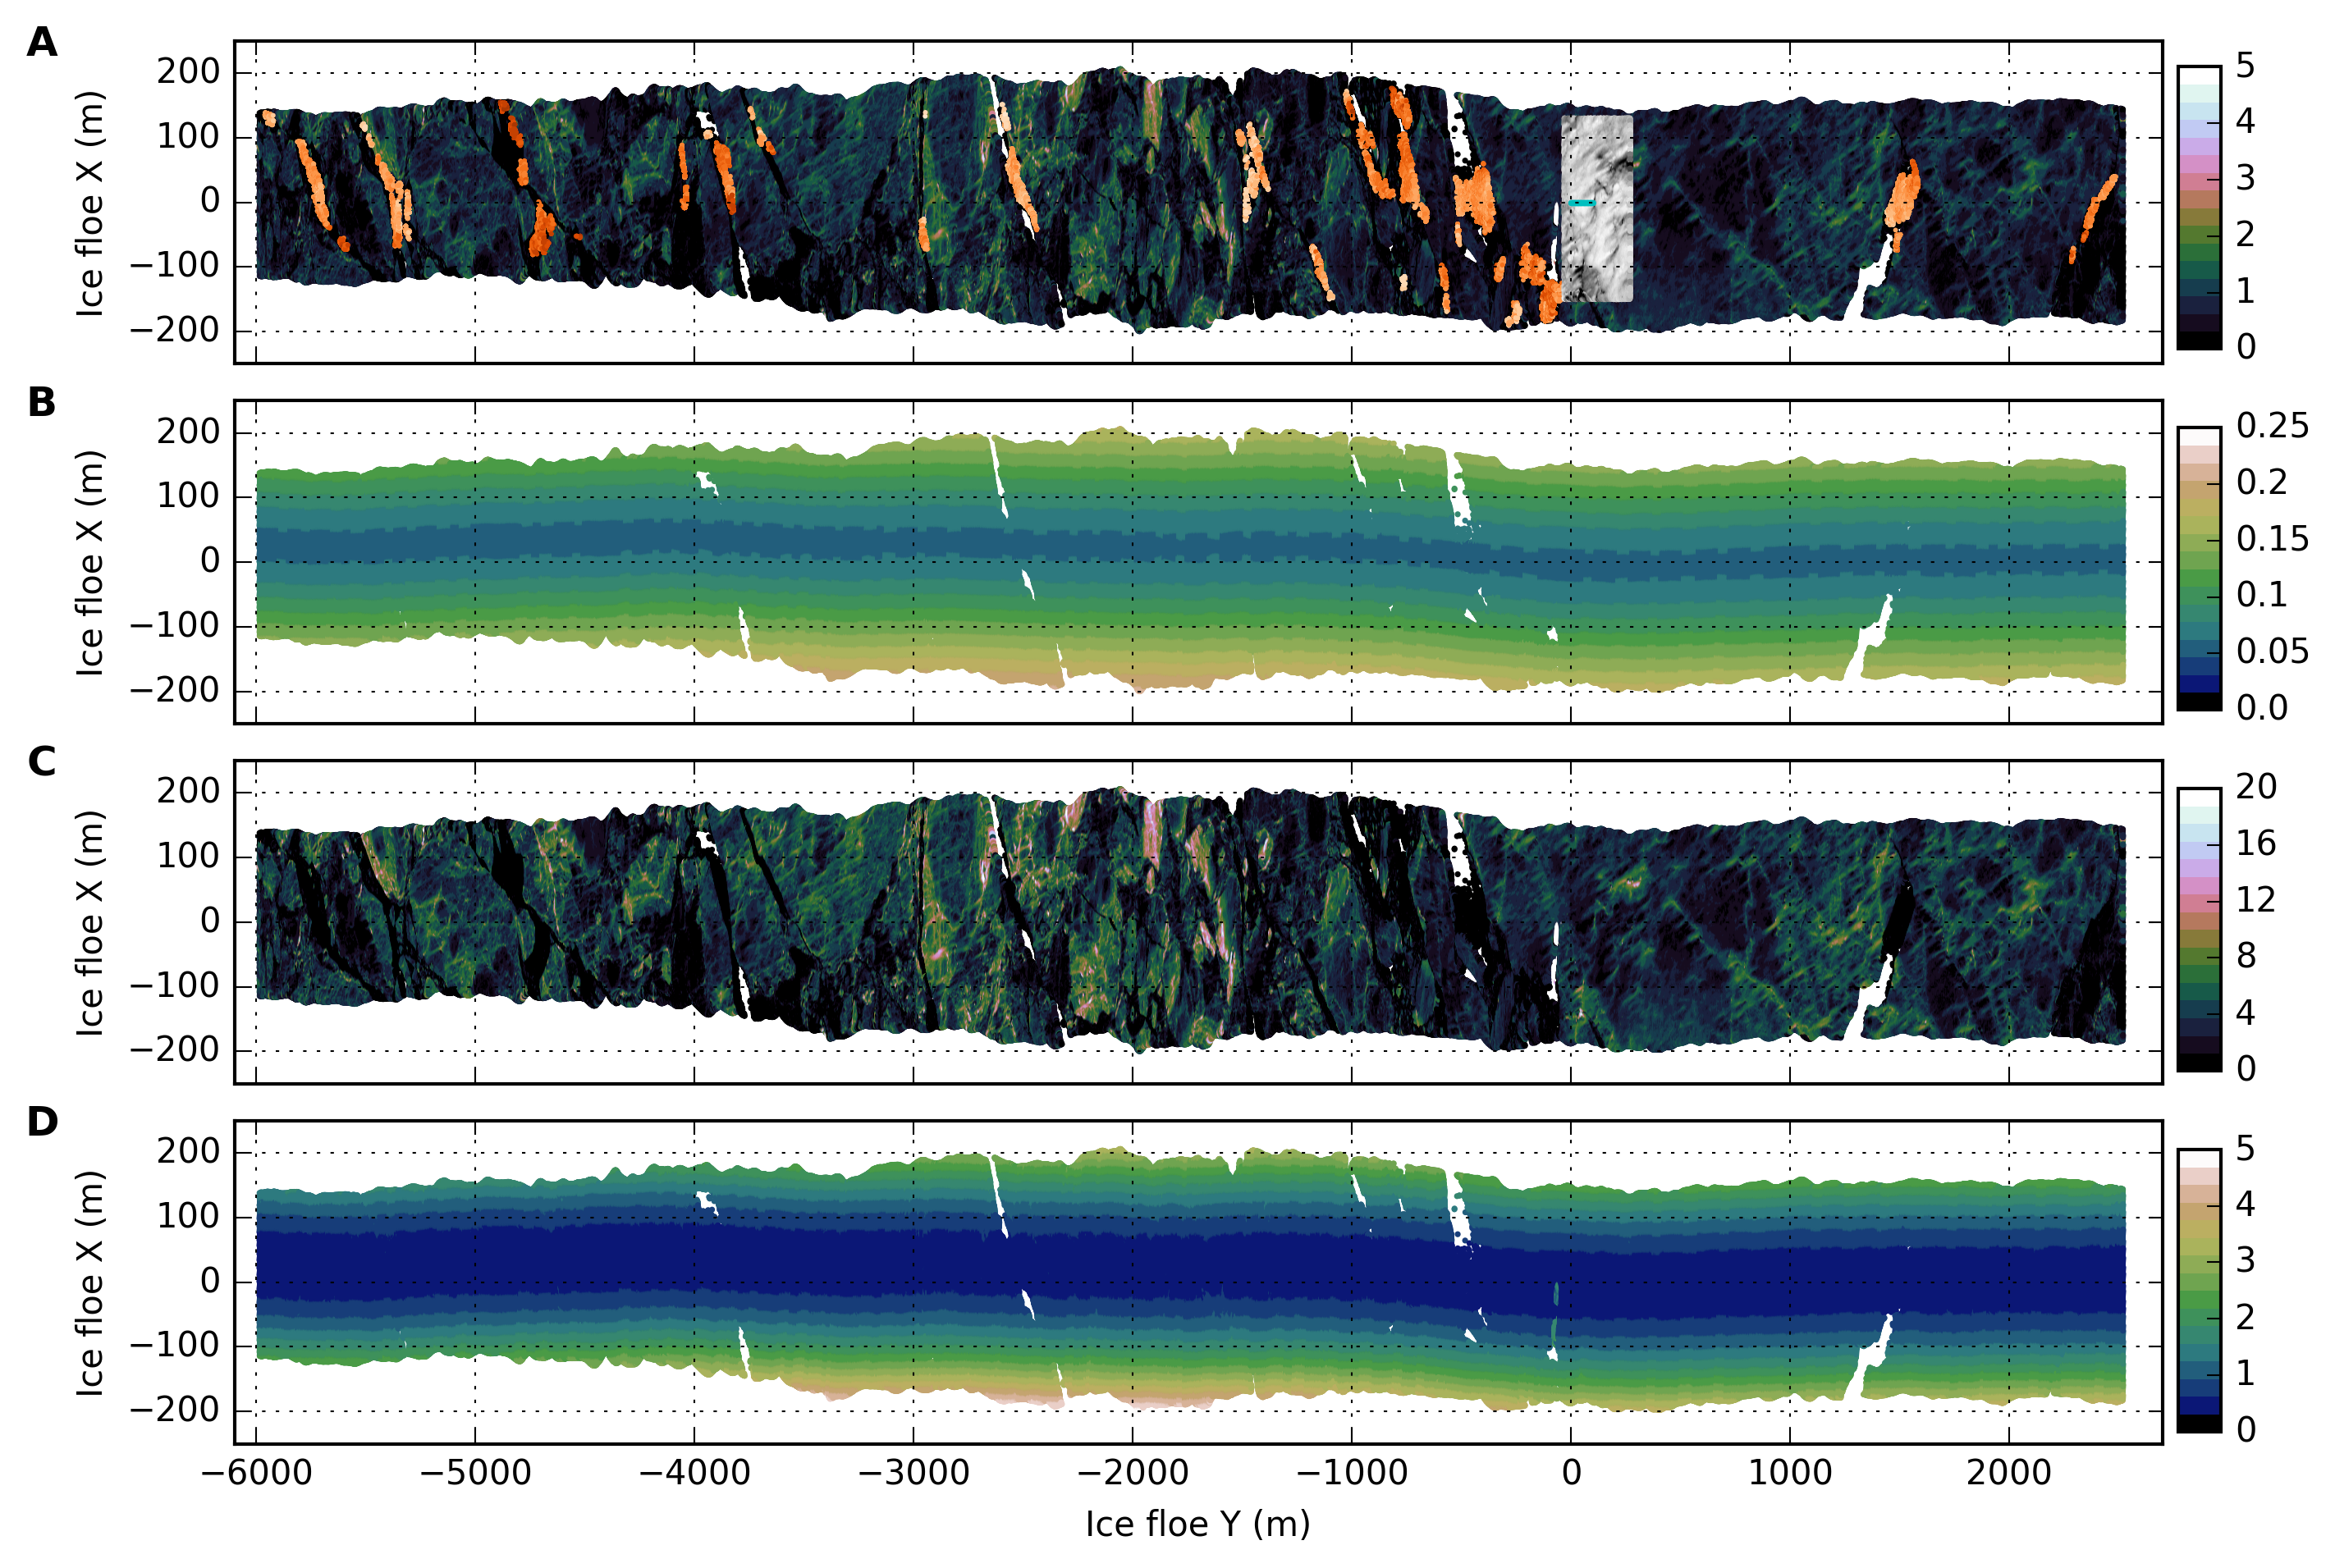
Results
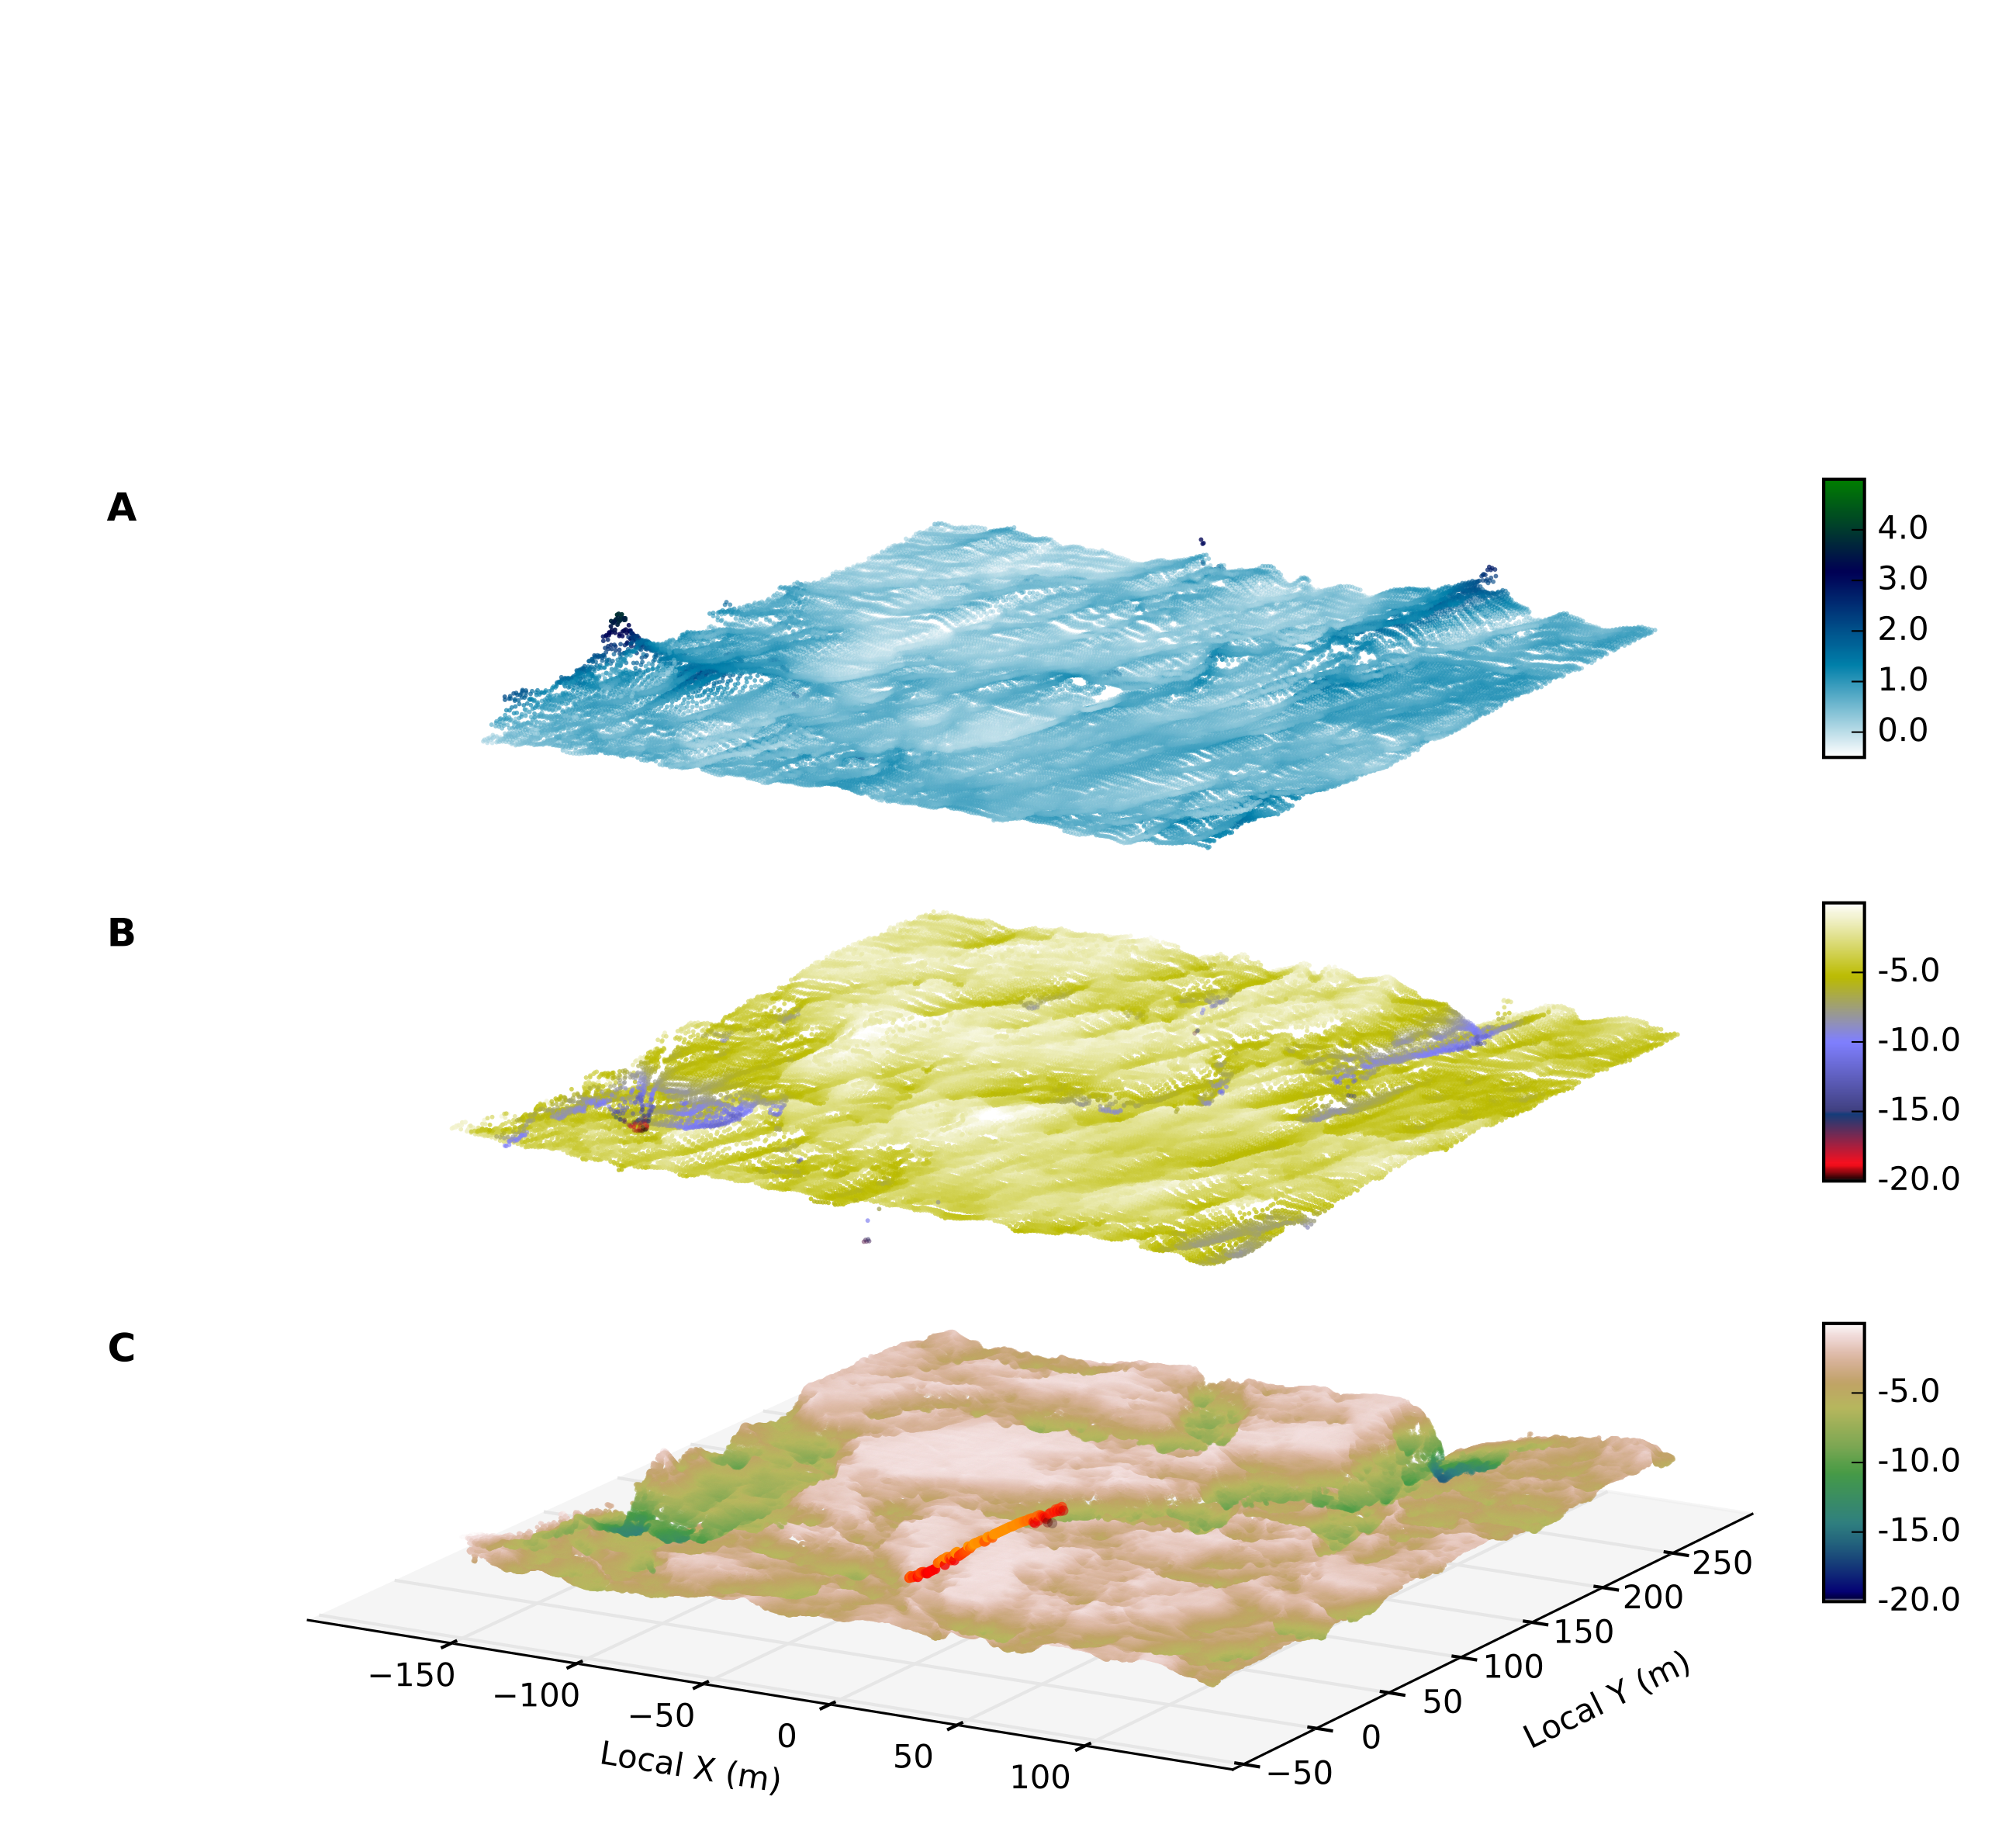
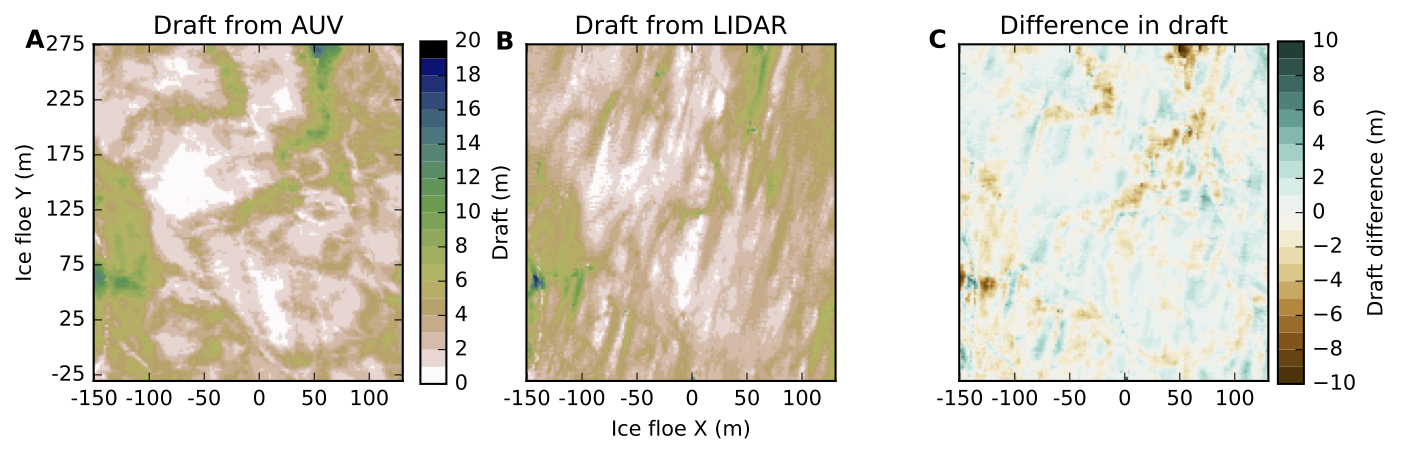
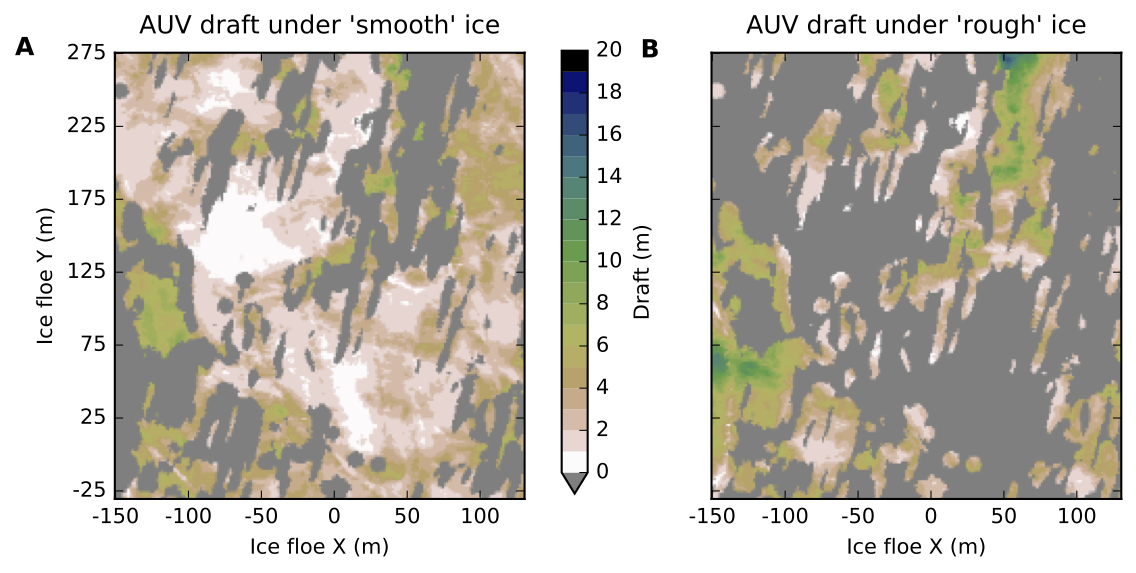
For this site, AUV draft and LiDAR draft are strongly correlated if we remove any spatial component and do a simple Spearman's Rho (0.7).
This means that most of the time there is thick ice under surface ridges. However, it's also easy to see that modelling ice draft from topography produces artificially deep and narrow ice keels.
The spreading of keels below ridges is well known, but rarely directly sampled.
Conclusions, and where to from here?
Using ship-based airborne sensors, we can investigate of sea ice which is too thick to navigate, too thin to walk on, and too far away/logistically difficult to approach using a fixed-wing flown-from-land aircraft
For the region studied, in situ observations underestimate ice thickness due to logistically-driven observer bias
Data quality improvements are simple - funding the work is less straightforward
This approach is optimised with a well coordinated and mutli-faceted field program
The airborne observations, ground survey and AUV observations are all interdependent. Take away one and the result is substantially degraded.
Final thoughts
Over 4 field campaigns the APPLS instrument collected more than 30 000 aerial photos, and hundreds of nautical miles of LiDAR.
These lie waiting for a keen analyst!
Thanks for listening
Questions? Comments? Field survey funding offers?
adam.d.steer@gmail.com
Fork my code (or make it go): http://github.com/adamsteer